View the following dashboards containing data for the rural counties.
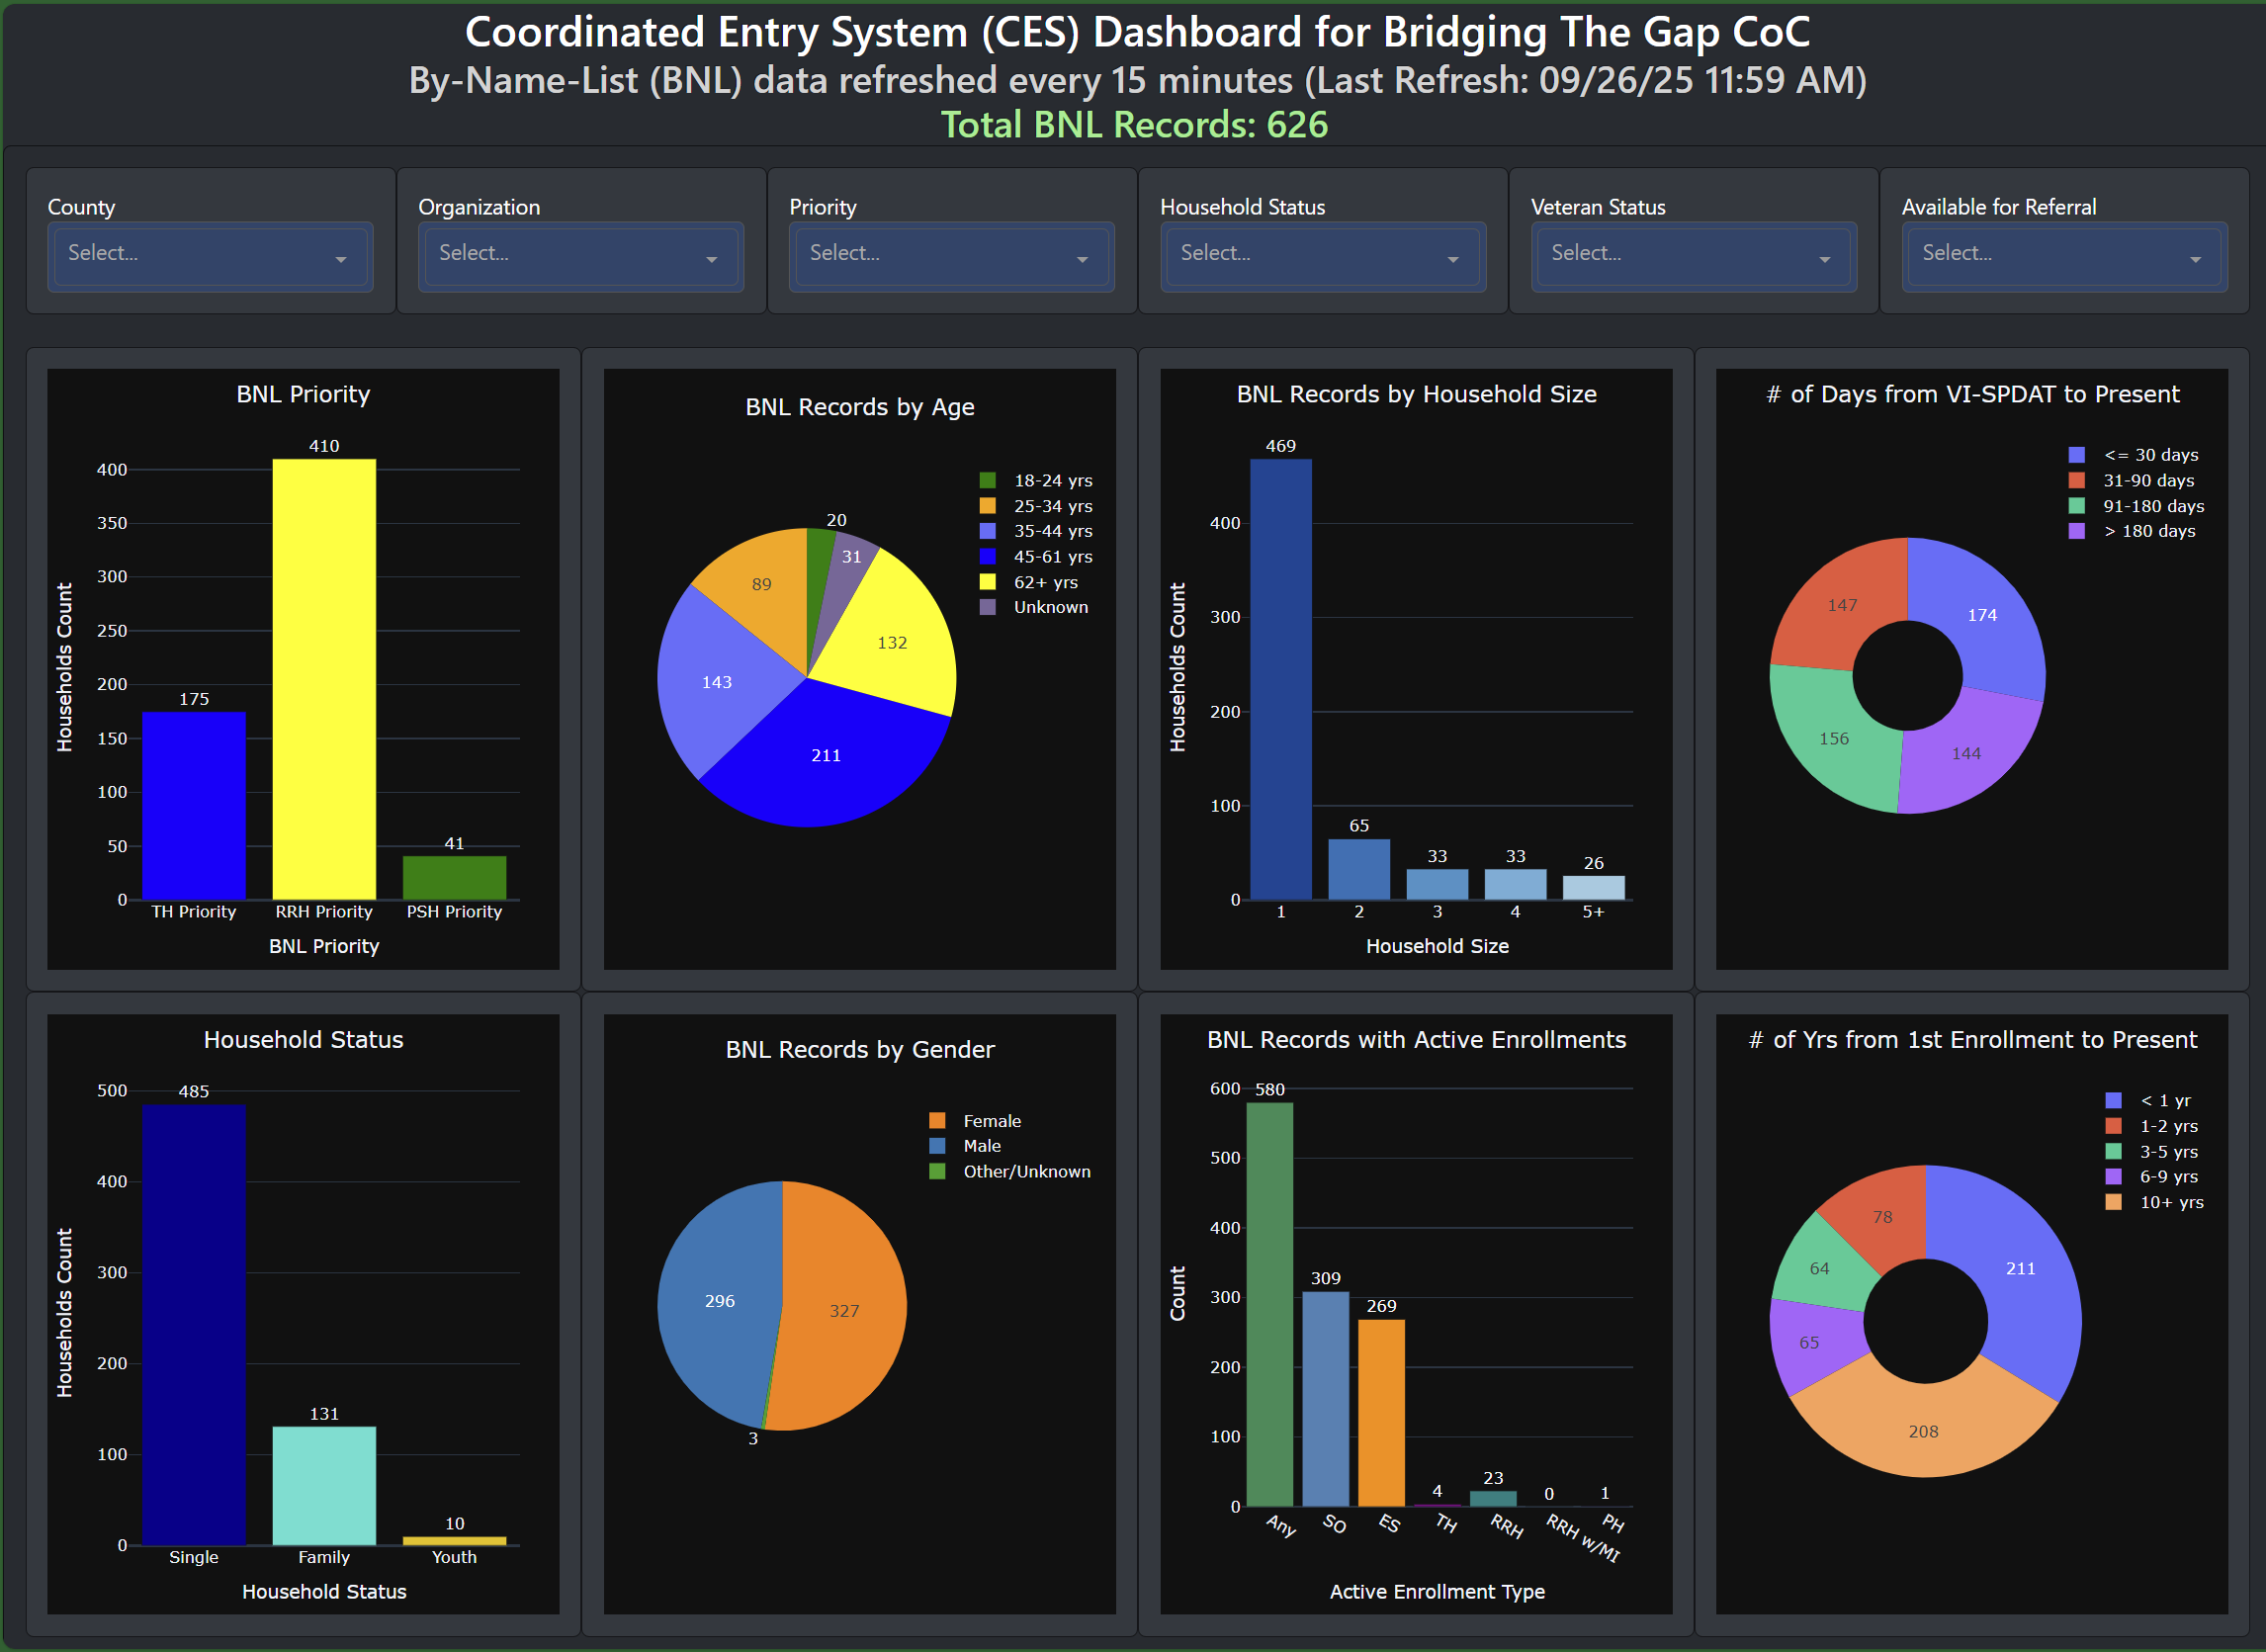
Coordinated Entry System (CES)
Provides summary data highlighting characteristics of households that are active on BTG’s BNL. The data is refreshed every 15 minutes and includes the total number of unique BNL records across all rural counties as basis for the charts shown. BNL characteristics presented in the charts include priority, household status, age, gender, household size, records with active enrollments, and length of time from VI-SPDAT or first enrollment. Data can be used to aid in funding decisions and filtered to help counties and organizations improve CES implementation. The automated HMIS referral process matches BNL records to available housing resources based on BTG’s approved prioritization algorithm.
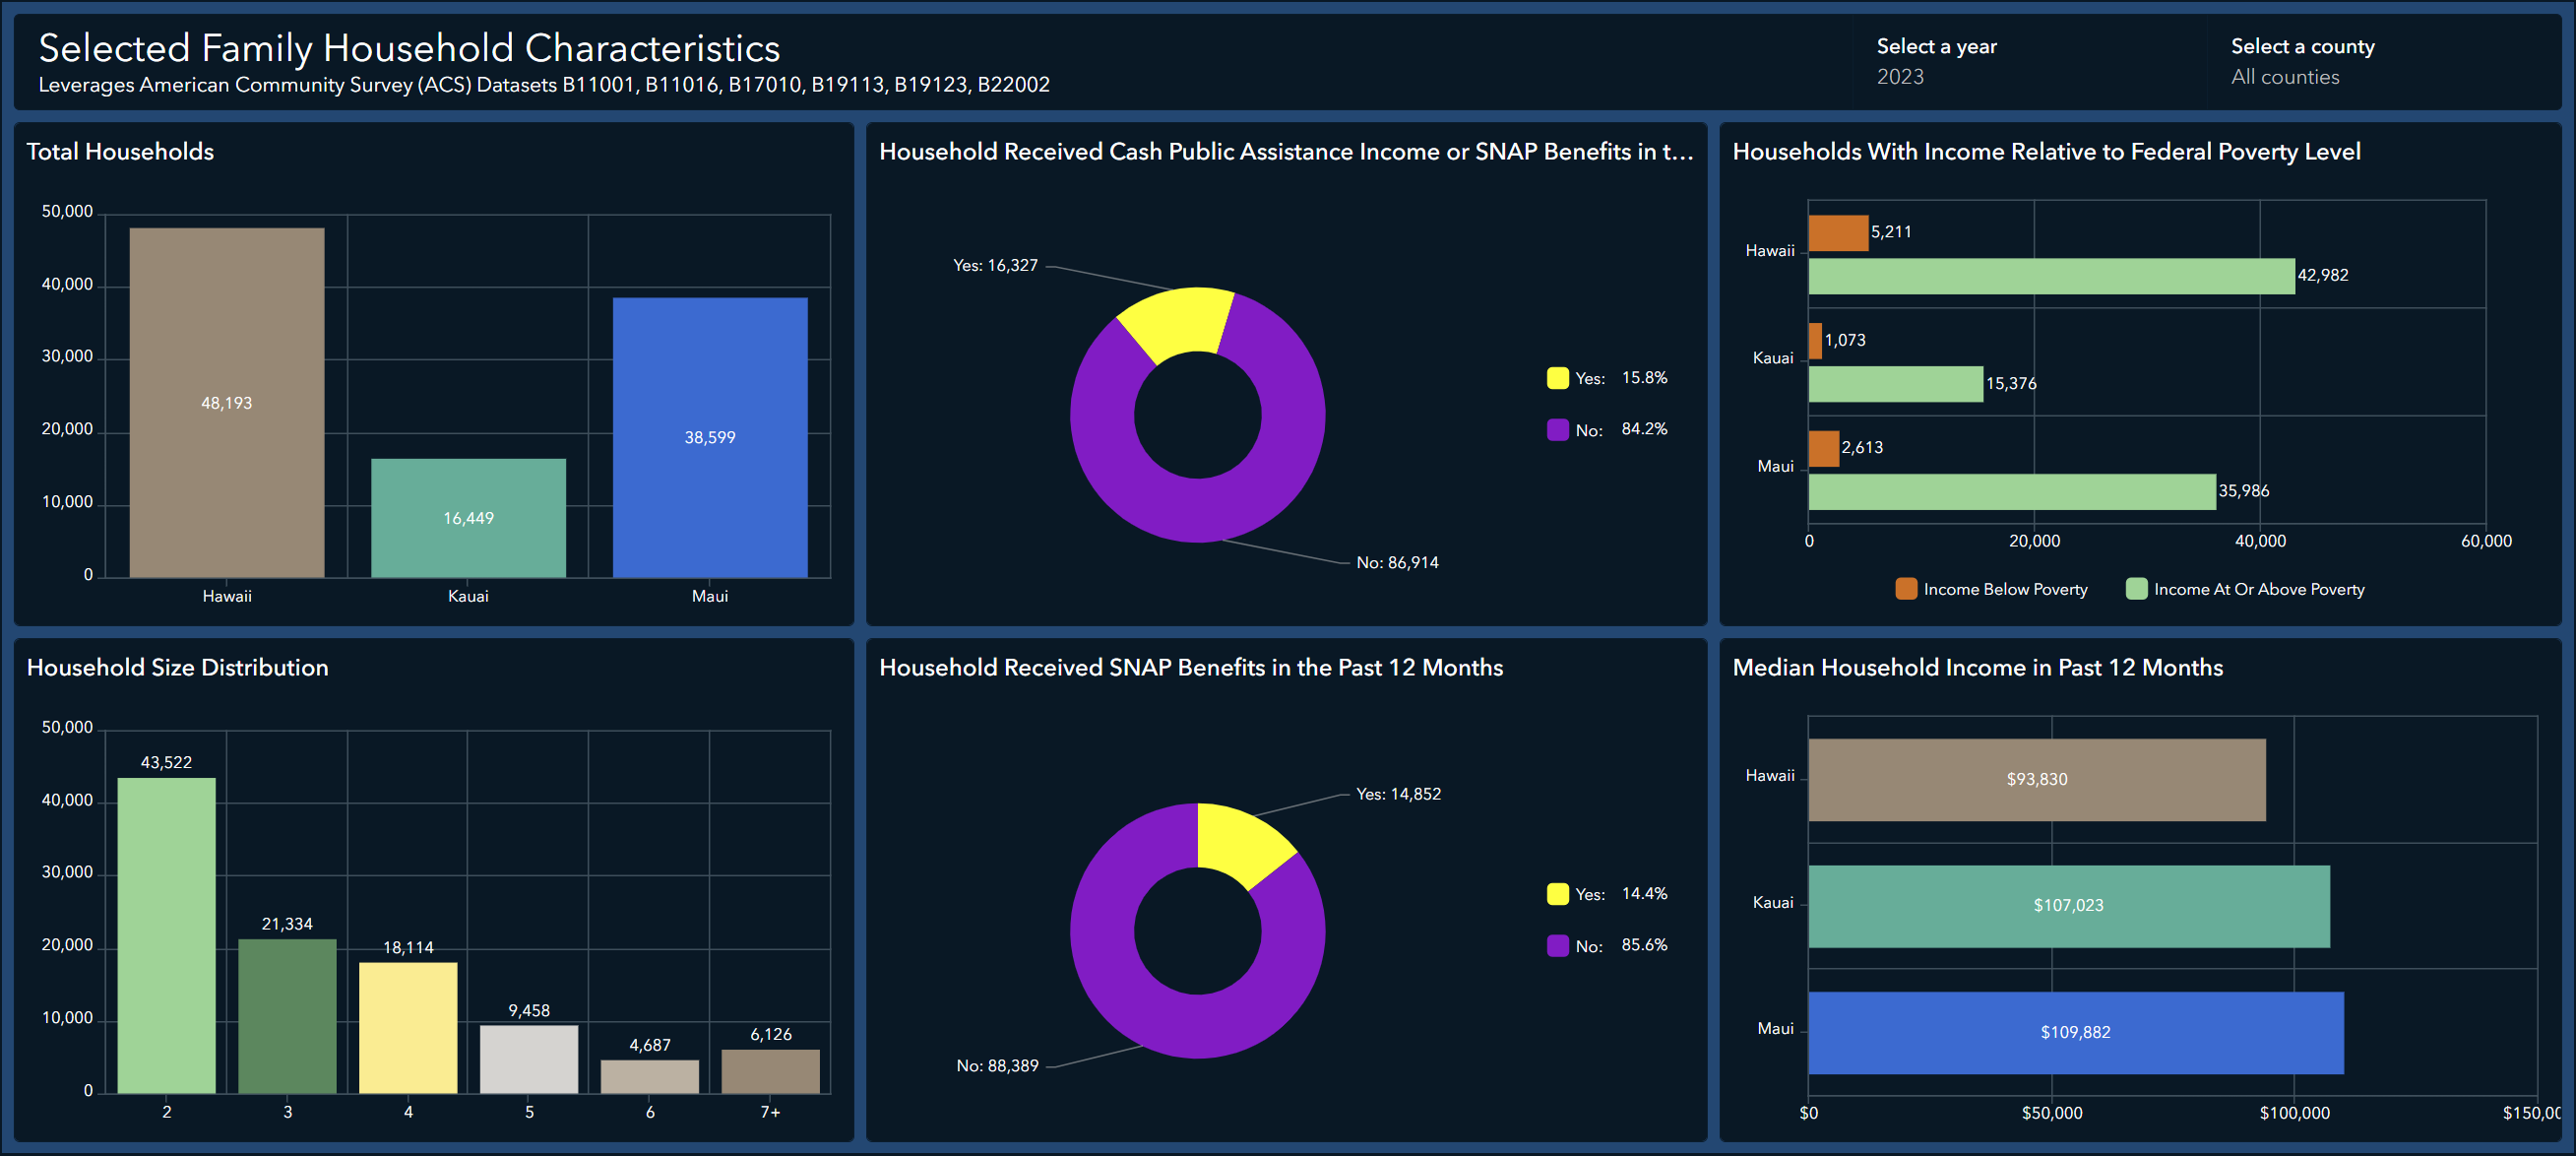
Census Bureau Estimates
Leverages selected ACS data tables to display demographic, social and economic estimates of the general population for the rural counties. References the most recent five-year data estimates conveyed through the Census Bureau Tables. Estimates can be compared to homeless population data within the rural counties to highlight demographic, social and economic disparities between these populations.
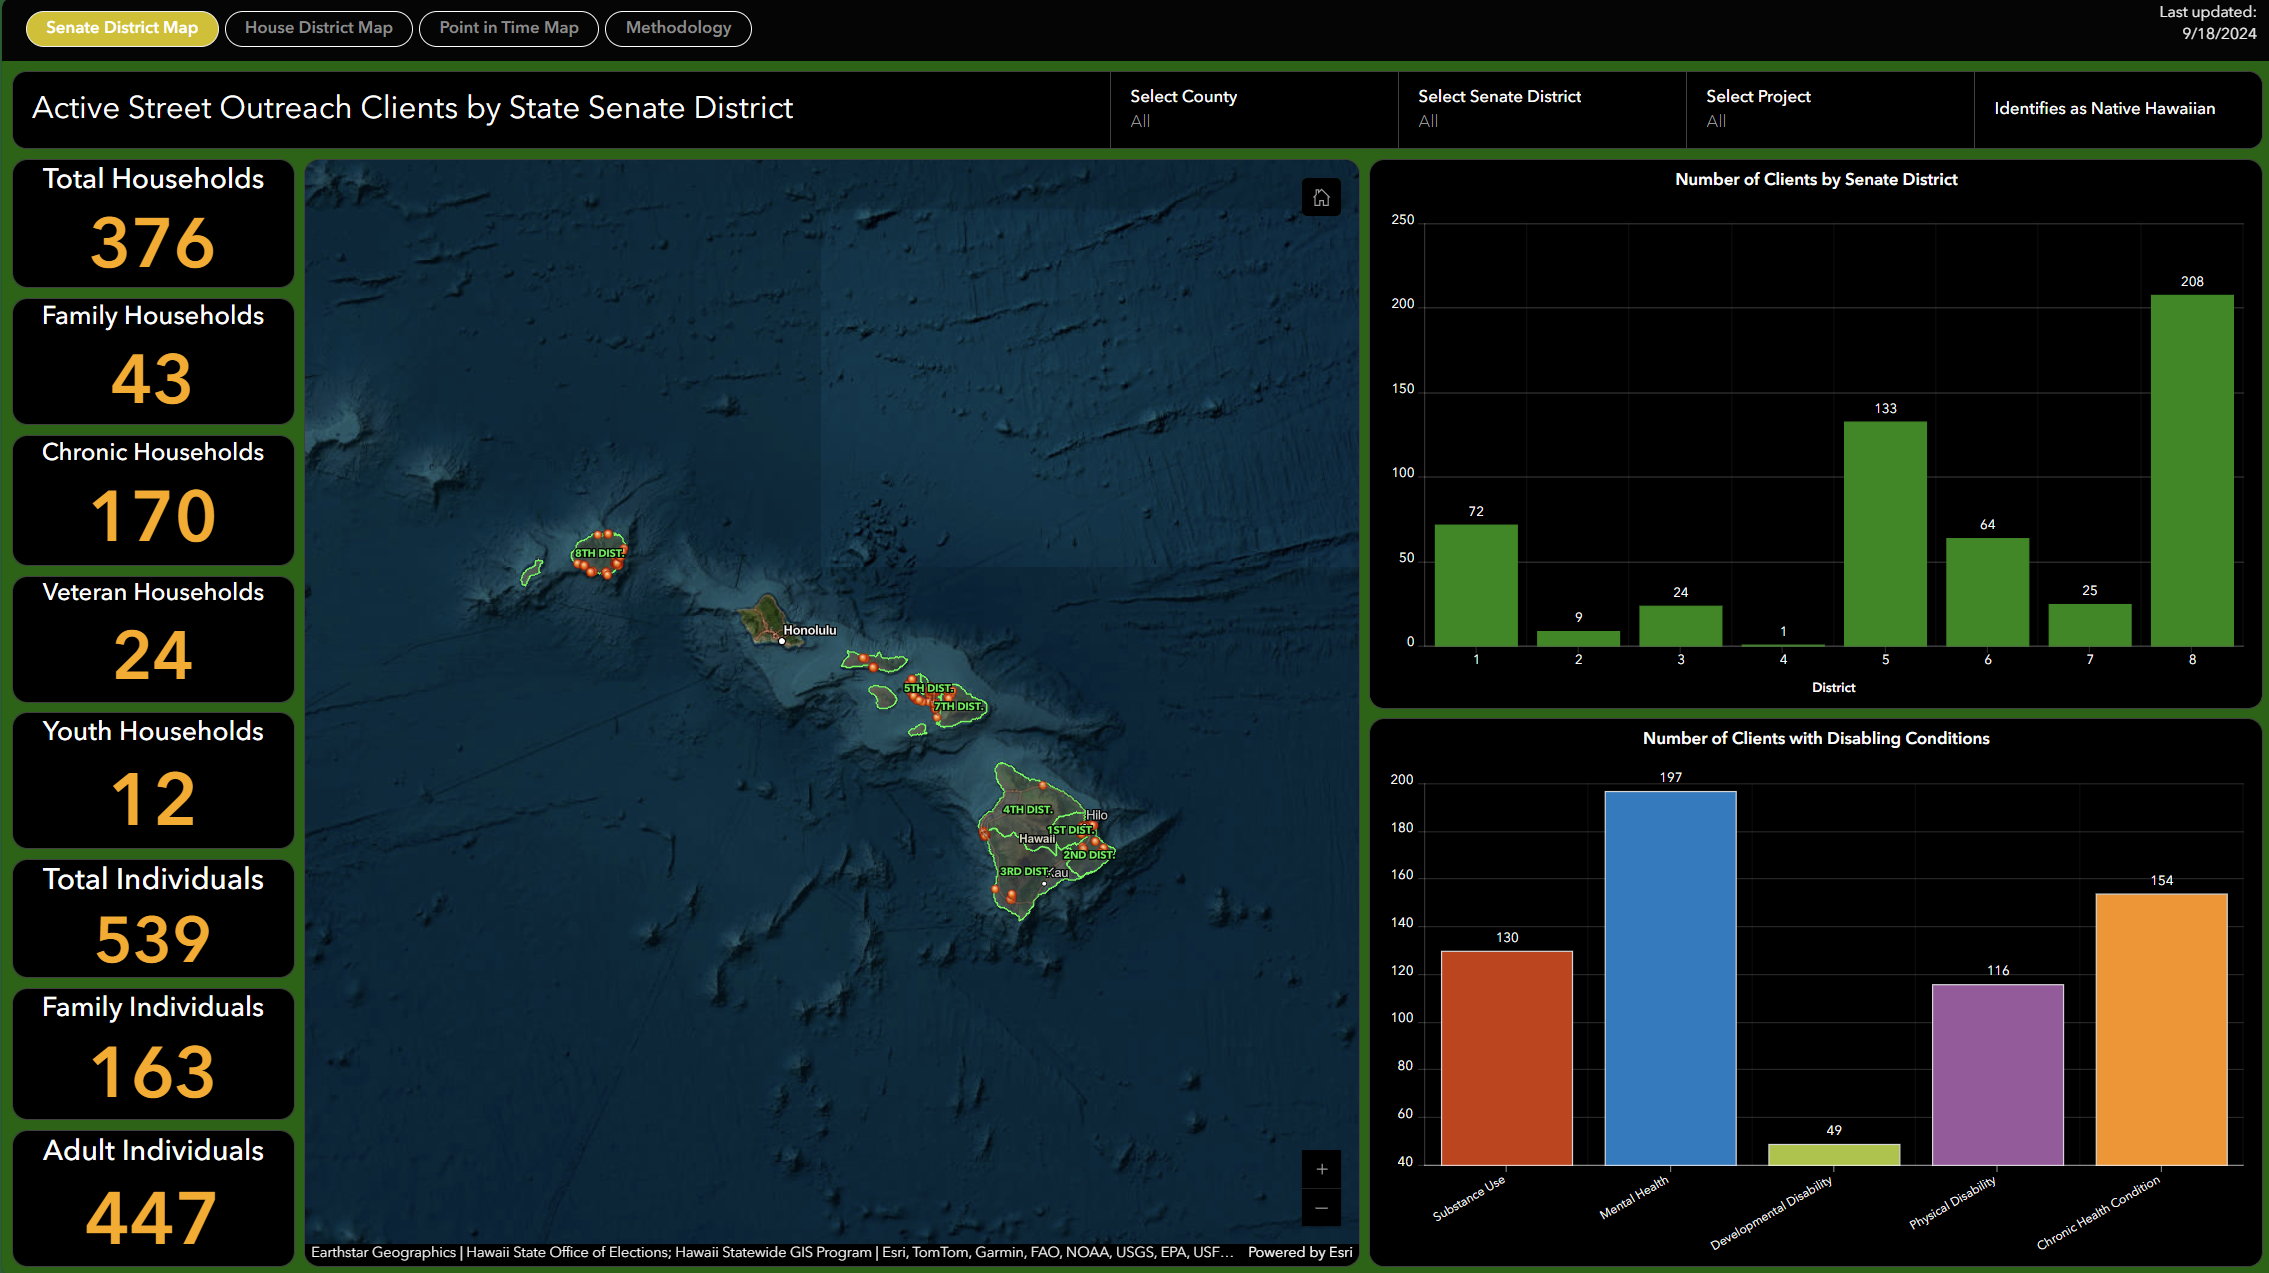
Street Outreach Data
Presents unsheltered street outreach data for the rural counties by state senate and house district, and point-in-time region/zone. Data is refreshed weekly to provide an unduplicated estimate of unsheltered homelessness that is based on BTG's HMIS street outreach project data. Clicking on the “Methodology” button above the dashboard title provides more information as to how the dashboard is configured and pulls data into the maps.
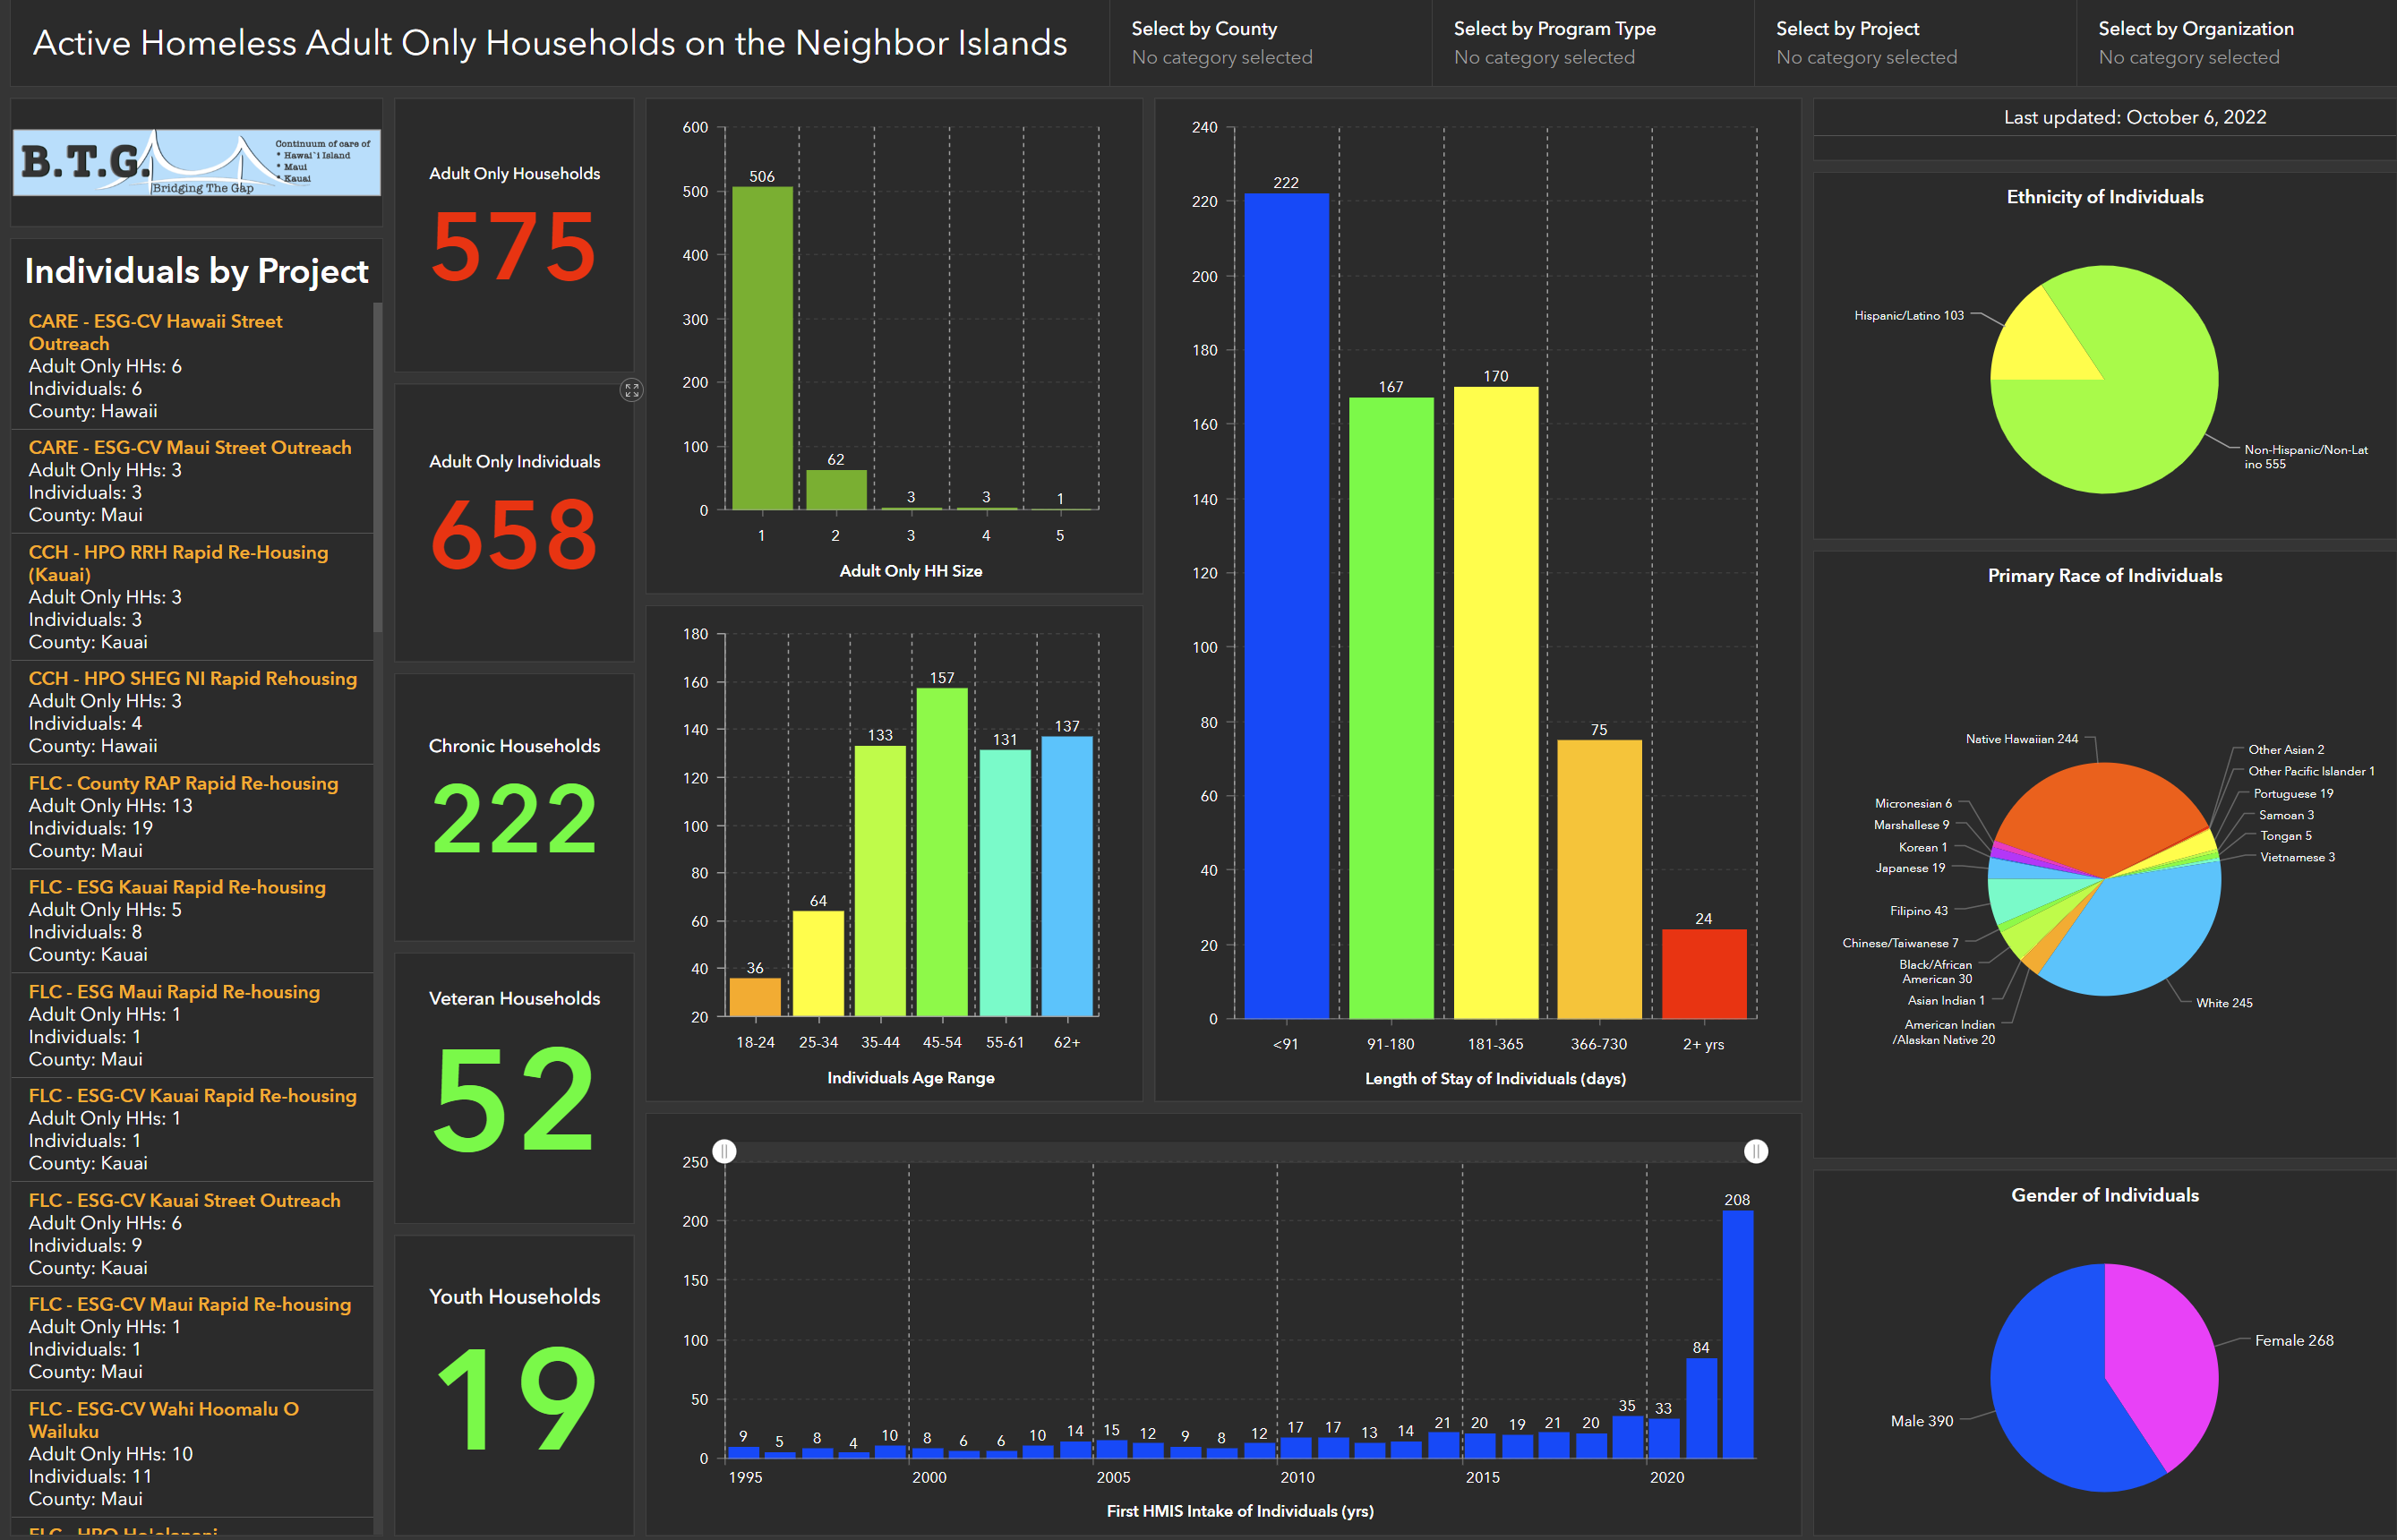
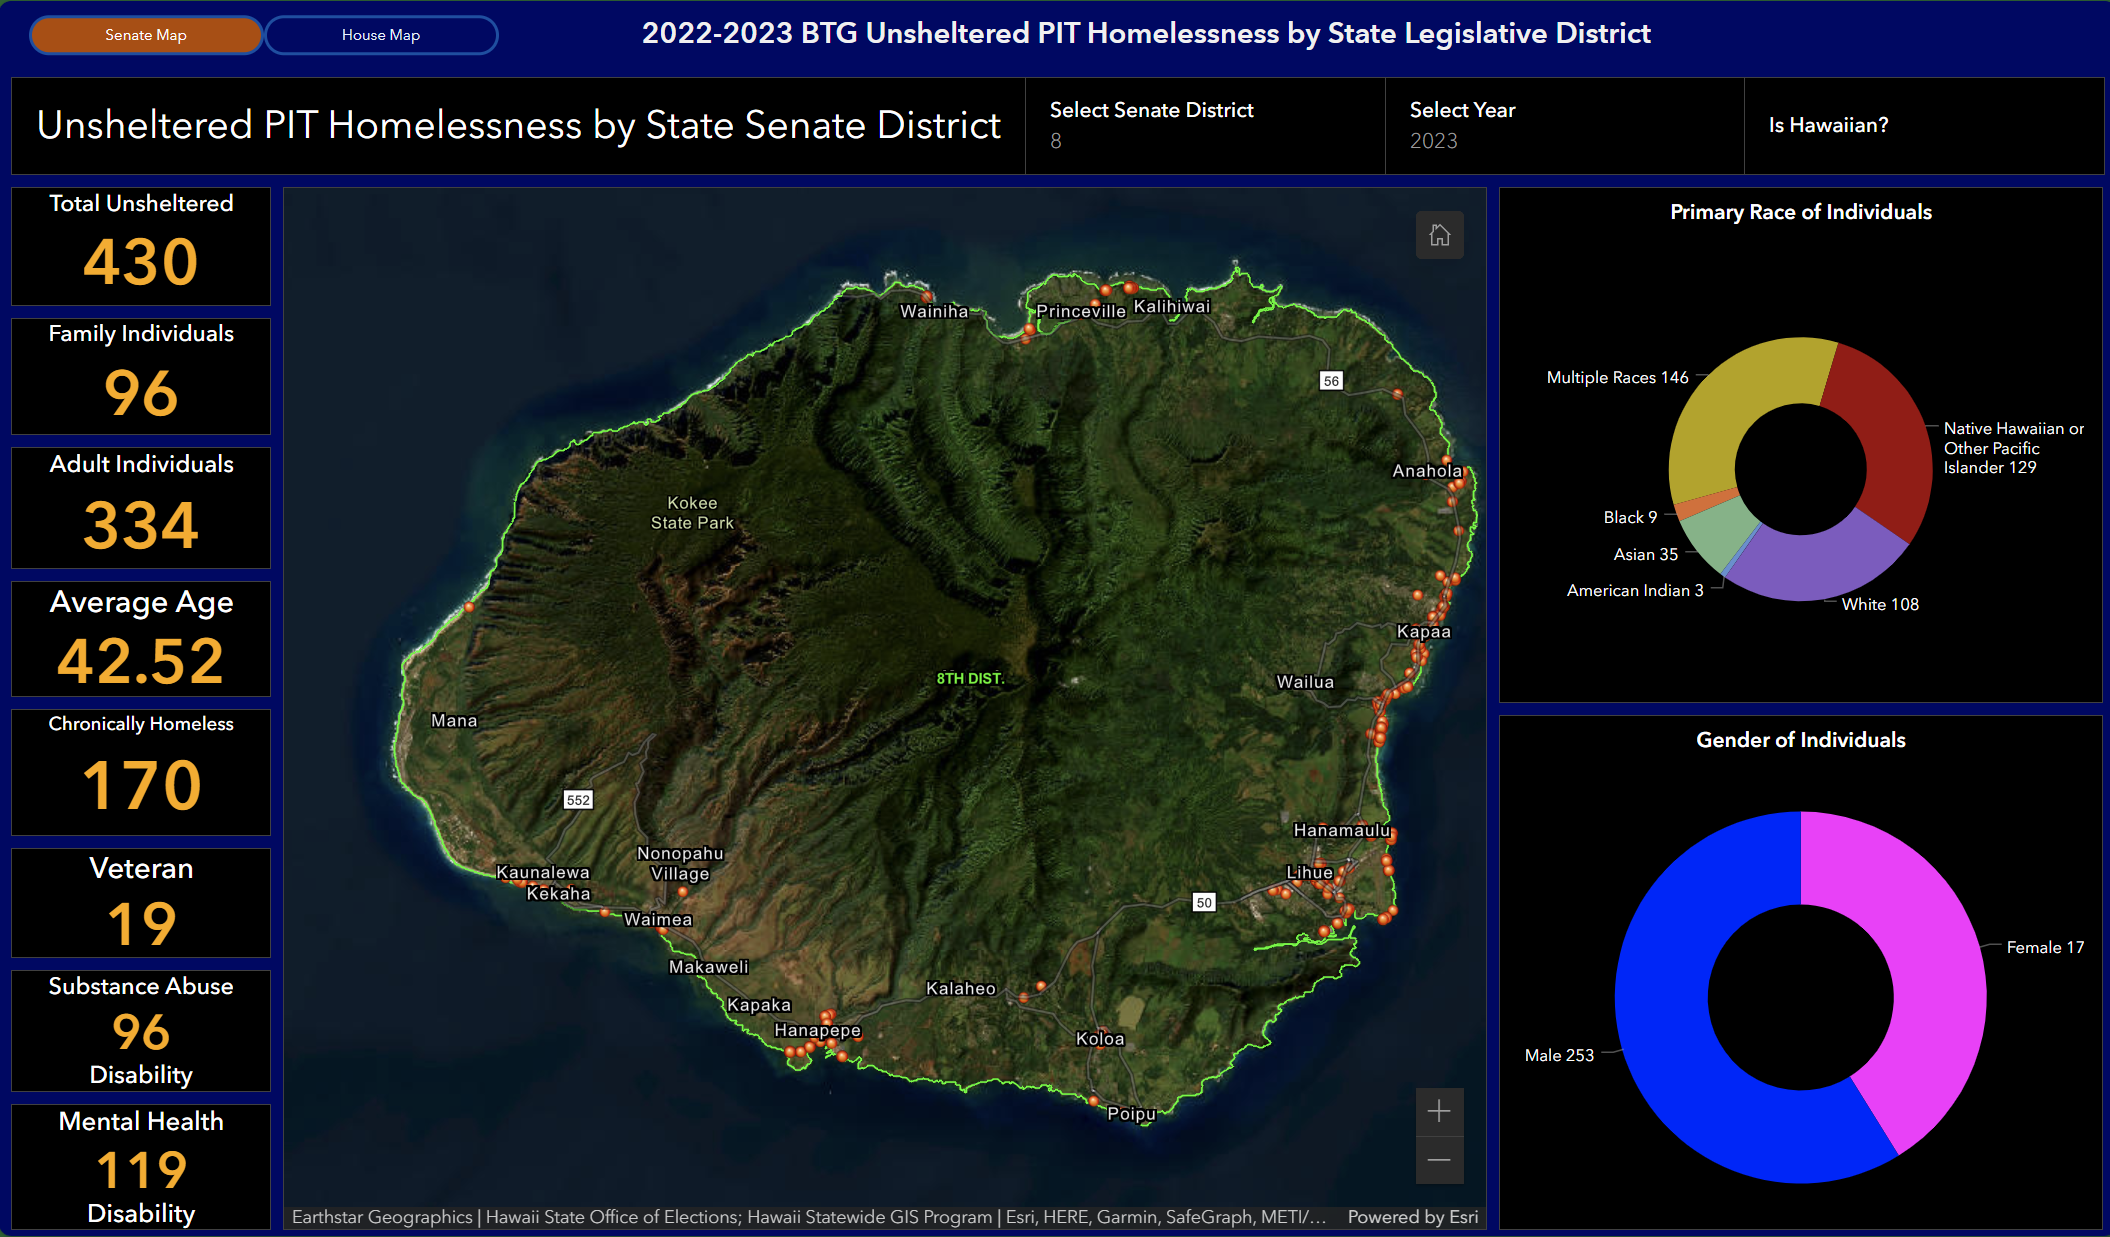
Census Data
Contains three census dashboards displaying characteristics of individual, family, and veteran homelessness. Data is refreshed daily and is unduplicated over the street outreach, emergency shelter, transitional housing, and rapid re-housing (without a housing move-in date) project types. The dashboard information can be used to understand how homelessness is changing over time and to implement strategies centered around reducing homelessness on the neighbor islands.
Emergency Housing Voucher Program
Offers transparency and accountability for HUD's special purpose emergency housing voucher program. The dashboard provides daily updates on leasing, issuances, and unit utilization, and information on voucher awards and funding by Public Housing Authority (PHA).
System Performance
Builds upon annual reporting completed by the University of Hawaii, Center on the Family from 2006 to 2017. Uses BTG HMIS data to show services and outcomes within the rural counties over the July to June fiscal year. Embedded charts and tables are filterable, making the data more relevant and accessible to stakeholders and participating organizations. Data can be used to highlight trends in service delivery and as benchmarks to improve future performance.
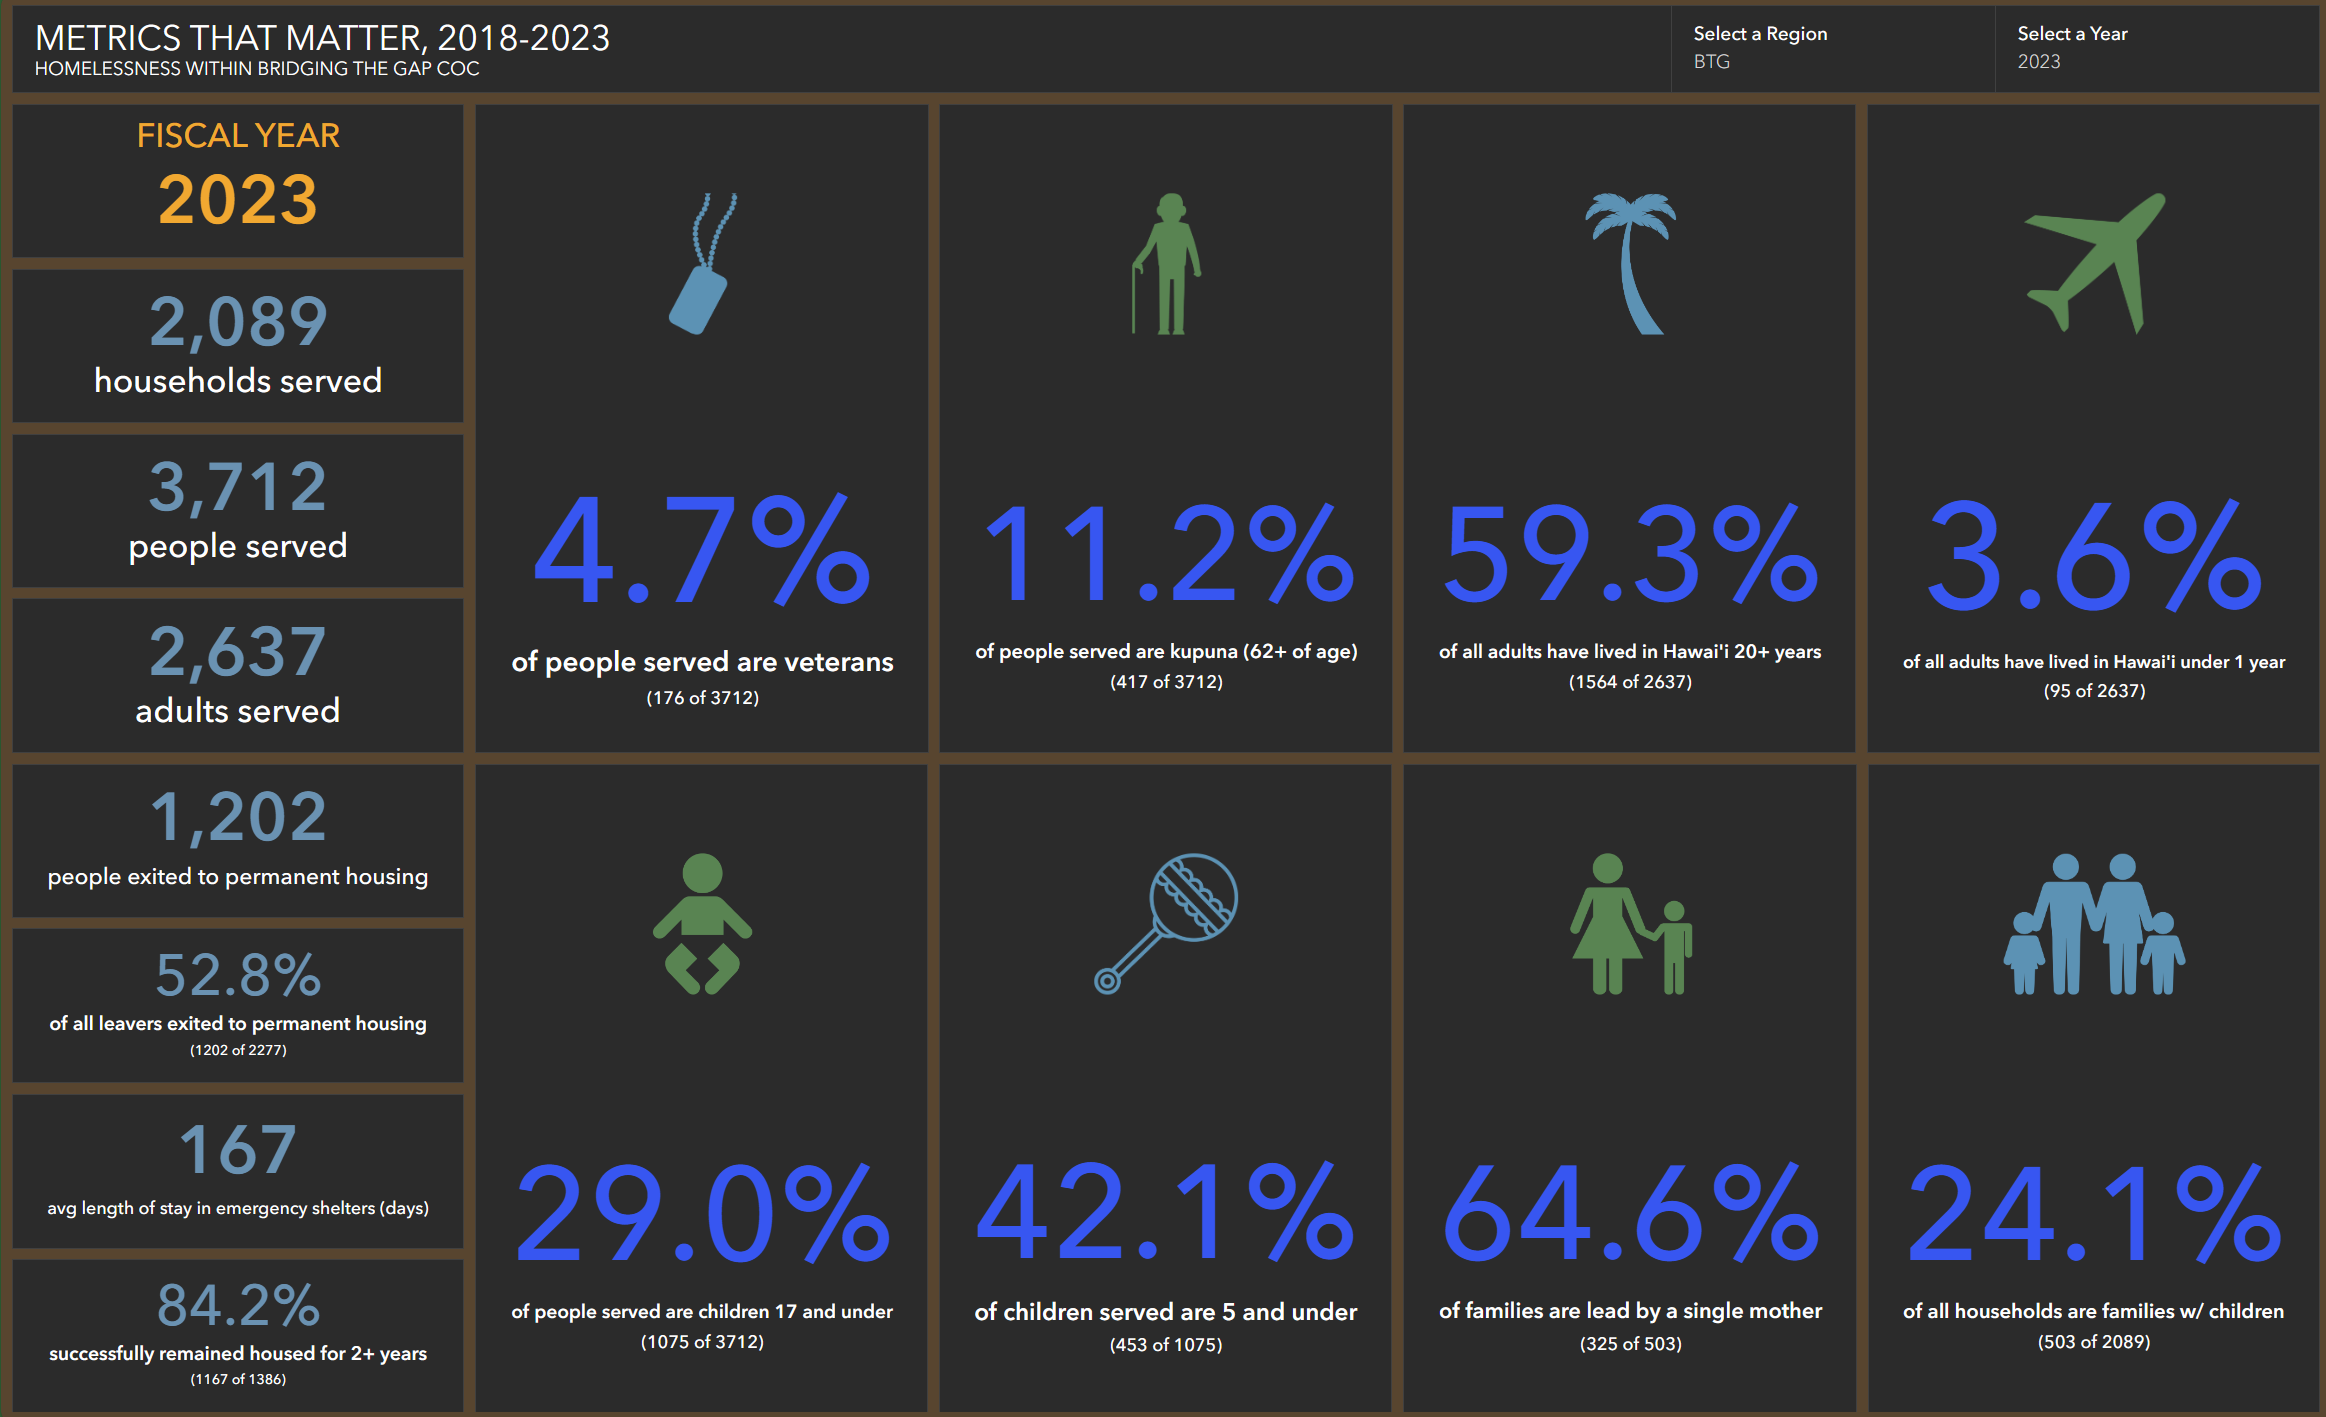
System Performance
Presents key statistics and performance data for BTG over selected July to June fiscal years. Data used to produce the figures is unduplicated over outreach, shelter, and rapid re-housing project types and can be filtered by rural county or fiscal year to enhance utility. Developed by BTG, the metrics identify important areas of focus and support local advocacy efforts.
System Performance
Highlights national system performance measure (SPM) summary comparisons showing box plots and national averages based on HUD’s SPM framework. Data used to produce the box plots and averages is pulled from annual Homelessness Data Exchange (HDX) SPM submissions for all CoCs nationally, using federal fiscal year as basis. The down arrow and tabs along the top of the chart toggle between measures, while filters are available within each measure to help narrow results.
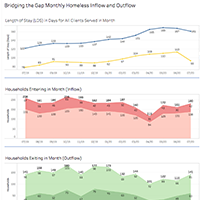
System Performance
Presents characteristics of the homeless services system using unduplicated data from BTG’s HMIS over street outreach, shelter, and rapid re-housing project types. Rapid re-housing project data includes client records with a housing move-in date. Charts include length of stay (LOS), households entering, households exiting, and households served and active at the end of the period.
PIT Count
Highlights sheltered and unsheltered point-in-time count data from 2015 to present. Includes trends in homeless populations, subpopulations, demographics, and unsheltered regional counts based on survey interview locations. Point-in-time data represents the best estimates of sheltered and unsheltered individuals experiencing homelessness on the neighbor islands on a single night in January and is critical for understanding the extent of homelessness.
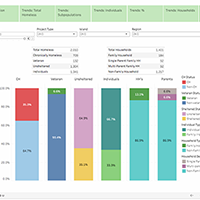
PIT Count
Shows data for clients surveyed during BTG’s unsheltered point-in-time count (PIT) in years 2022 to 2024. Chart data and points in the map viewer can be updated using the filters in the left column. The map viewer displays points that represent where the PIT interview took place. The dashboard adds geographical context that supplements annual reporting and enables users to easily determine summary data across a range of attributes.
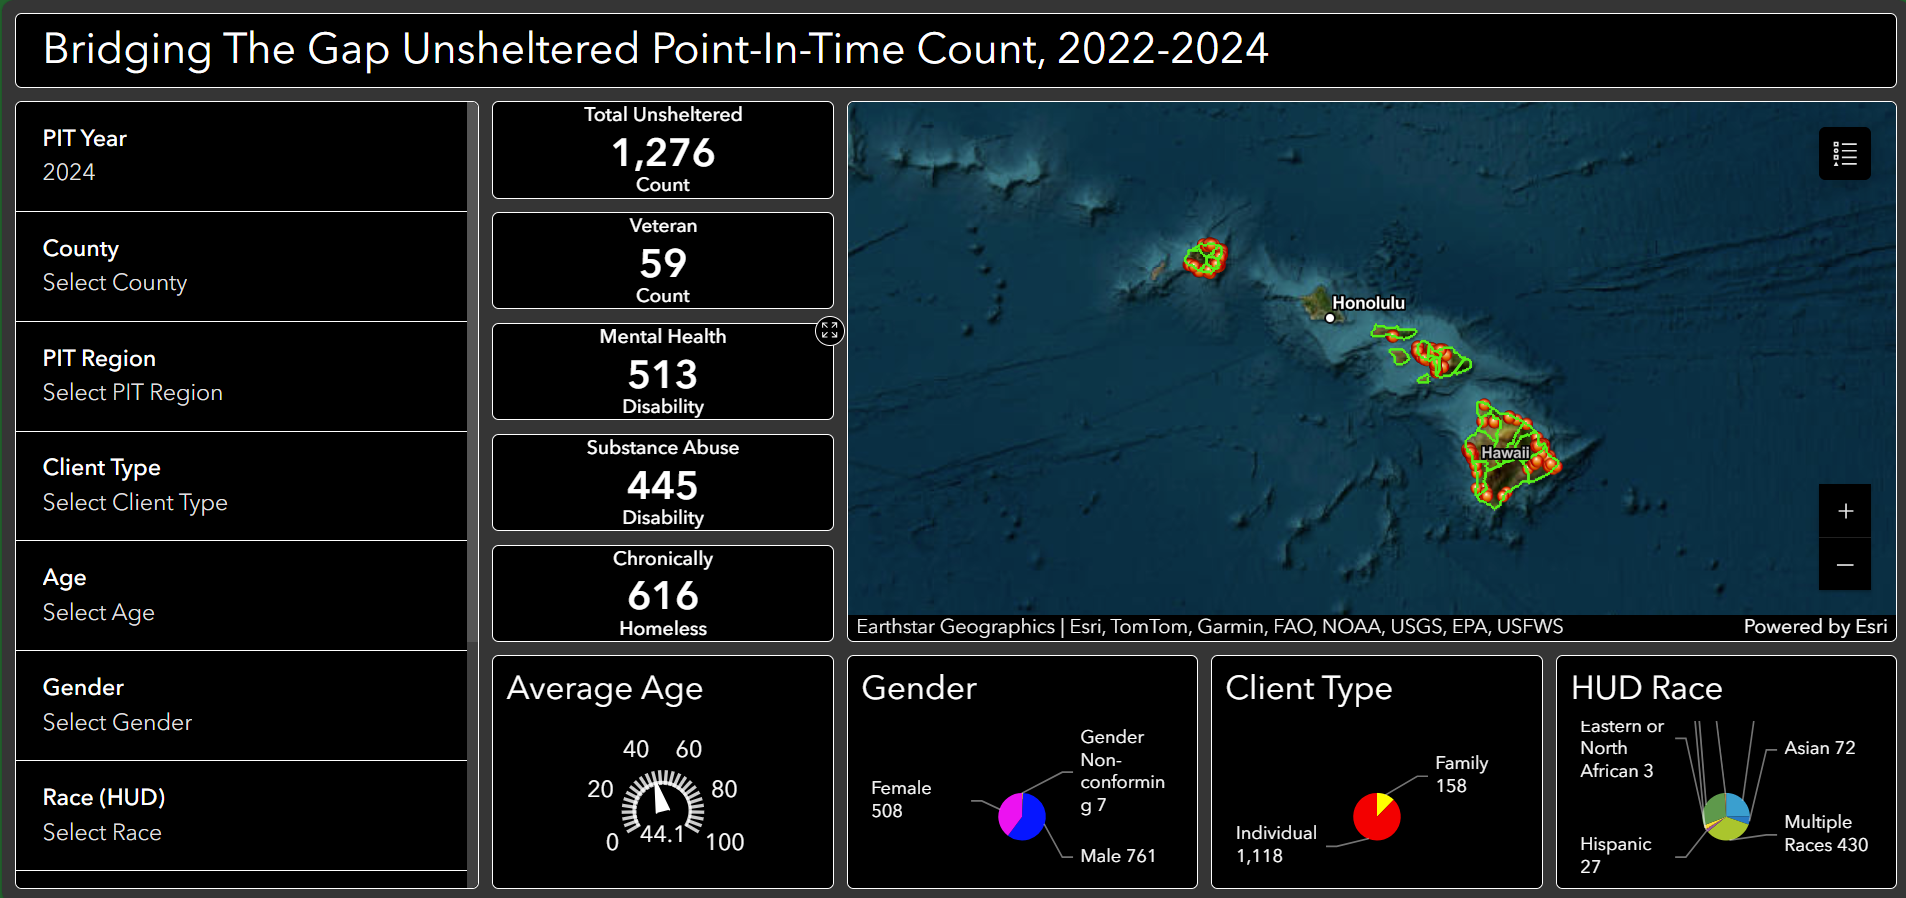
PIT Count
Displays selected unsheltered point-in-time count (PIT) data by state legislative district for years 2022 to 2024. Buttons in the upper left enable users to toggle between state senate or house maps. State legislative district boundaries overlay each map, and the chart filters can be applied to update statistics, map points, and pie charts based on selection. Clicking anywhere in the legislative district will display legislator contact info. The Hawai`i State Legislature page provides more information for all legislators.