Aside from Point-In-Time Count results, the HSU dashboards use July through June as the report period. The dashboards build upon annual reporting completed by the University of Hawaii, Center on the Family (UH) from 2006 through 2017. While UH emphasized statewide service utilization and trends, the following tables and charts focus on BTG and the rural counties of Hawaii, Kauai, and Maui. Data used to produce tables and charts has been extracted from BTG’s HMIS. Short narratives accompany each of the sections to help explain methodology. Many of the tables and charts use the same universe of clients, unduplicating over street outreach, emergency shelter, transitional housing, and rapid re-housing project types. Nearly all tables and charts include various filters to enhance the usefulness of the service data and outcomes presented. The funding source filter allows users to segment data based on whether projects were funded through the State Homeless Programs Office (HPO).
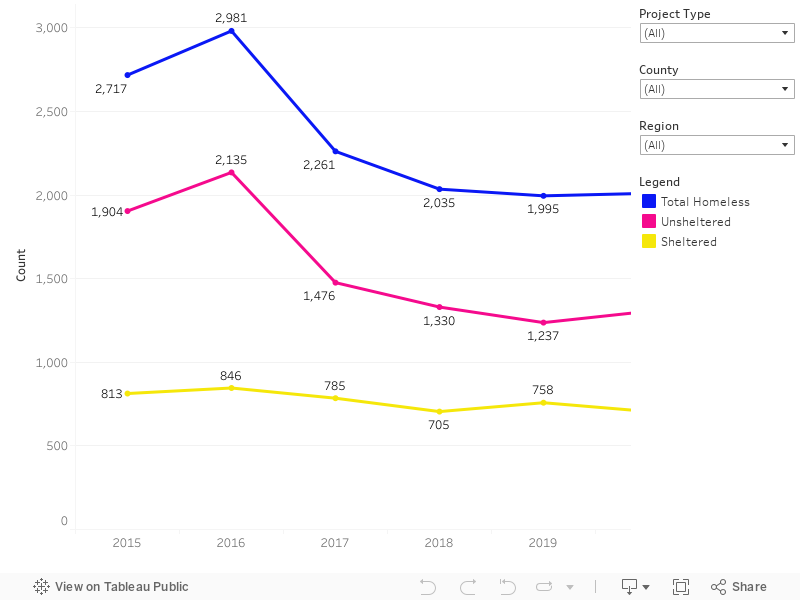
Presents PIT data from 2015 to present. Annual PIT data estimates the level of homelessness for BTG on one night during the last ten days in January. The total homeless estimate for each year includes both a sheltered and unsheltered count. BTG did not conduct an unsheltered count in 2021 and 2025, thus the break in data for those years. Visit the Point-In-Time Count (PIT) link for more information.
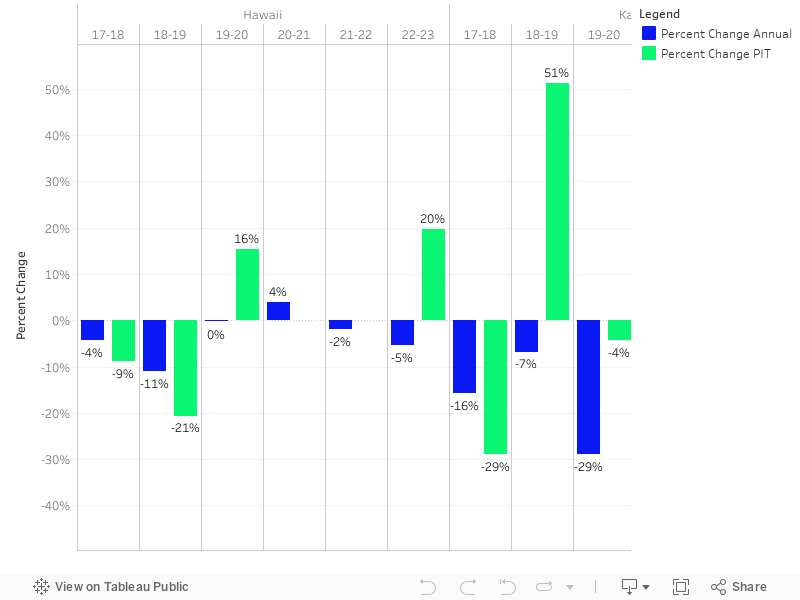
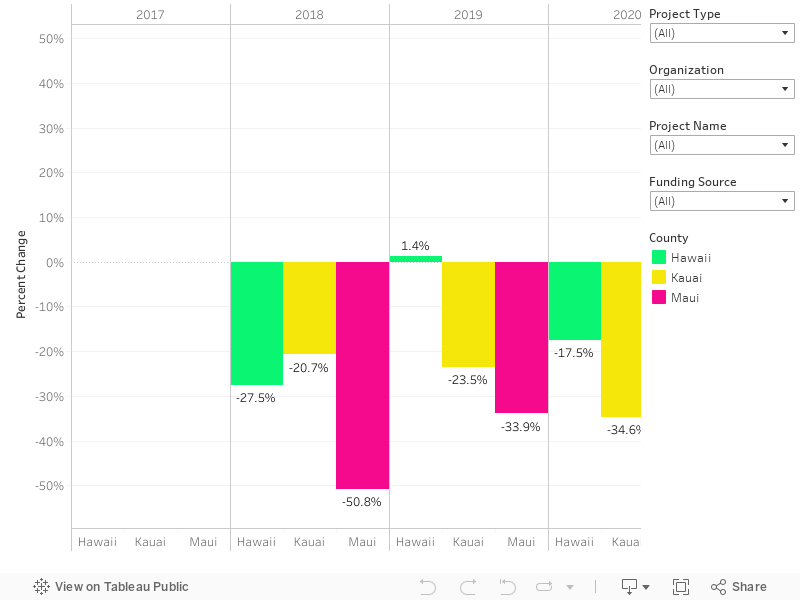
Presents the percentage change in annual PIT data and percentage change in people served annually through street outreach, emergency shelter, transitional housing, and rapid re-housing projects. PIT comparisons are not available for 2021 and 2025 since an unsheltered count was not conducted in either of those years. The count of clients served annually is determined by unduplicating over street outreach, emergency shelter, transitional housing, and rapid re-housing projects. The percentage change is then calculated by comparing these counts annually for the years presented.
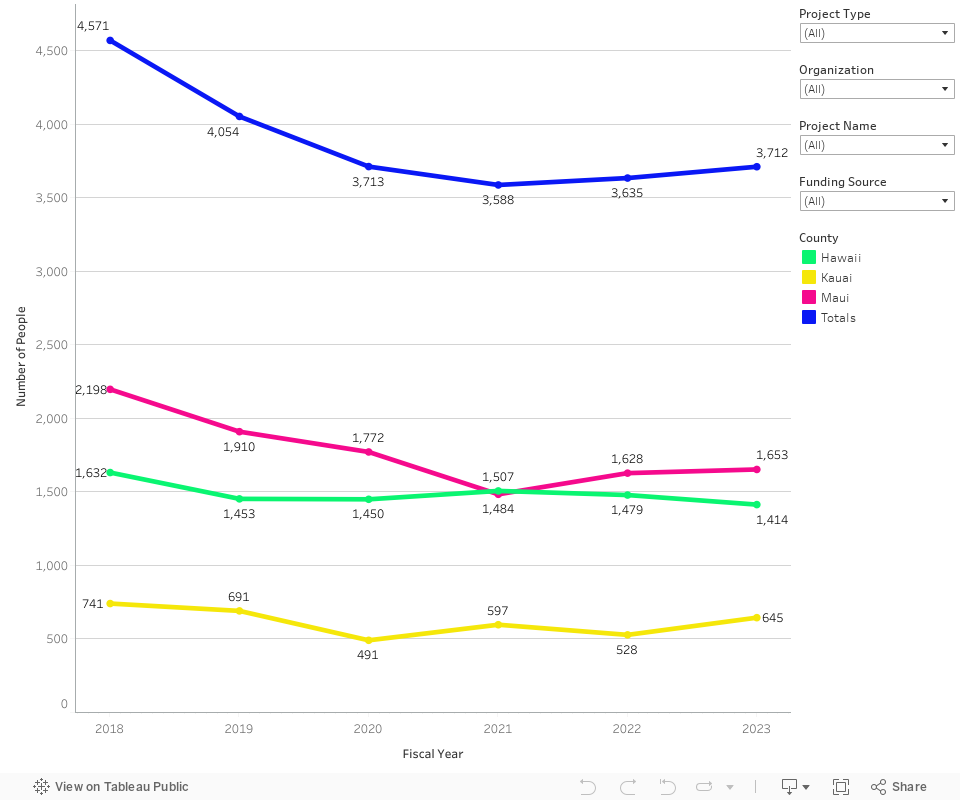
Displays the total number of people served annually for BTG and the rural counties. The BTG count is unduplicated over street outreach, emergency shelter, transitional housing, and rapid re-housing projects. Selecting the “Rapid Re-Housing (Housed)” option in the project type filter displays the number of people that moved into permanent housing at some point during the enrollment, which is demonstrated by having a housing move-in date recorded in the system. Selecting the “Rapid Re-Housing (Homeless)” option will display the number of literally homeless people that have not moved into permanent housing at any point during the enrollment, which is articulated by not having a housing move-in date recorded in the system.
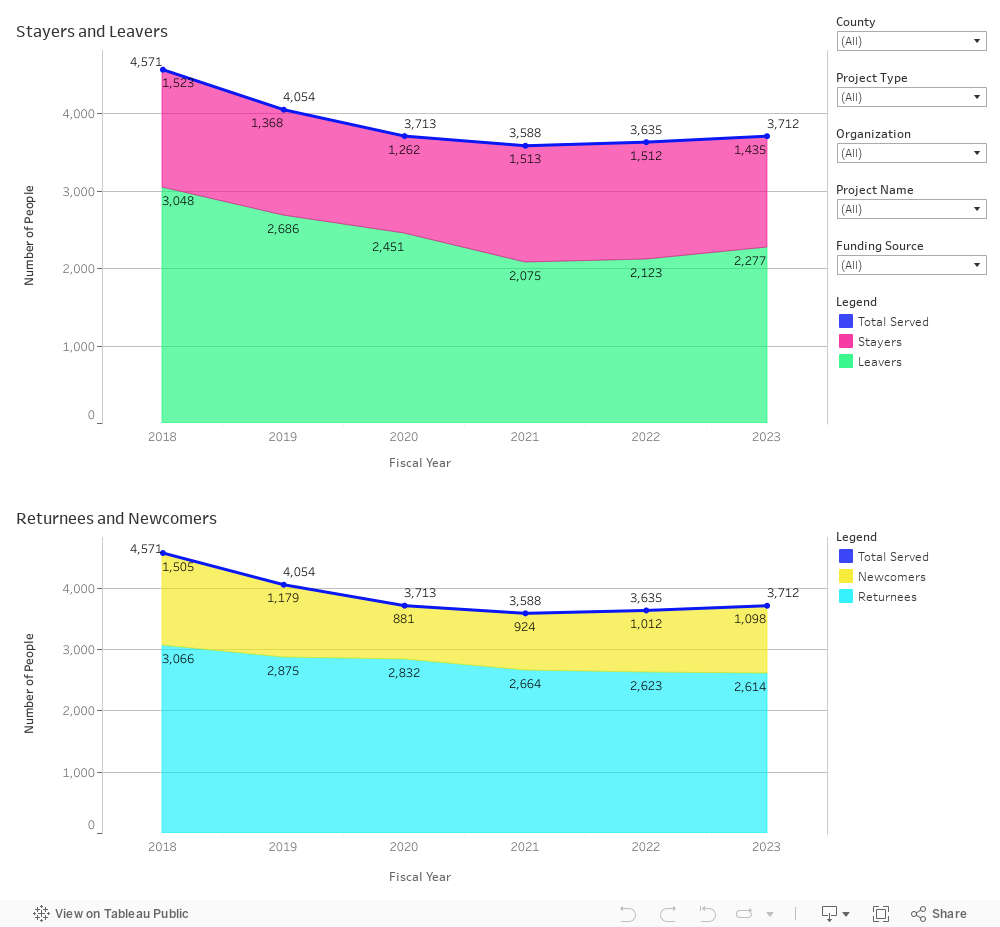
Presents two charts showing the number of unduplicated people served annually. The first chart separates total served into stayers and leavers. Stayers remain actively enrolled at the end of the year, while leavers exit at some point during year. The second chart separates total served into returnees and newcomers. Newcomers have no HMIS history prior to the current enrollment, while returnees have at least one enrollment prior to the current enrollment.
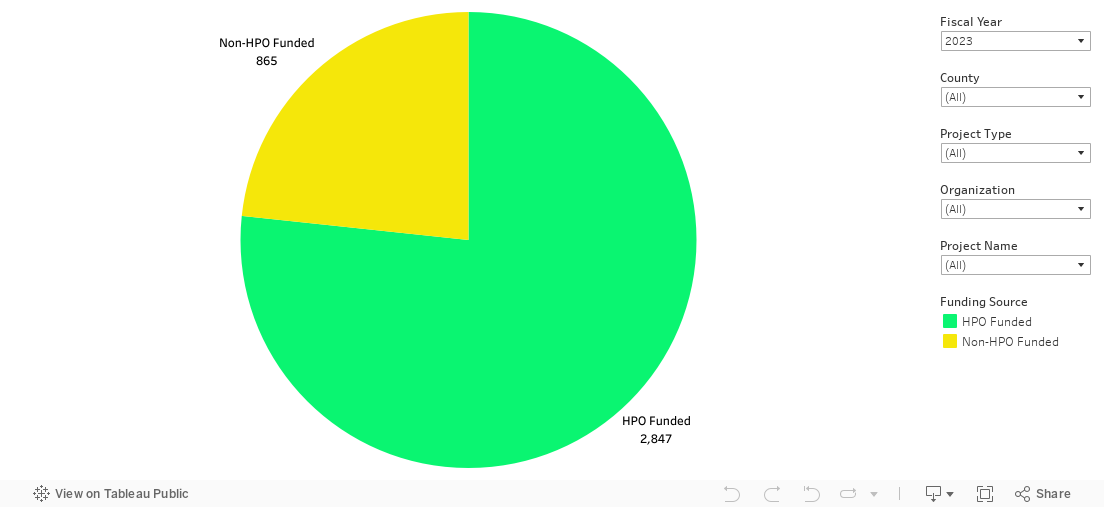
Displays total people served during the year while distinguishing between whether they were served in HPO funded projects. Hovering over the sectors produces a tooltip that shows the percentage of total.
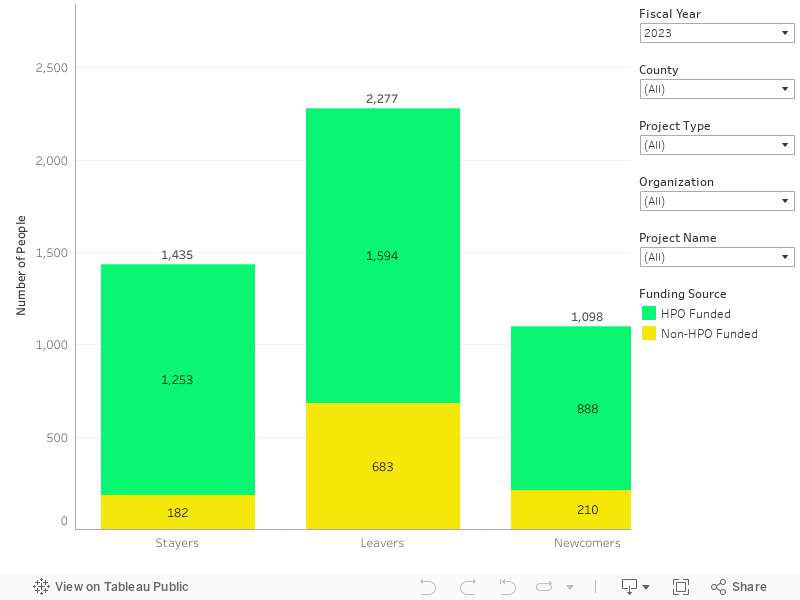
Displays four subgroups along the x-axis, highlighting in green the number from HPO funded projects, and yellow the number from non-HPO funded projects. Subgroup definitions are presented in Figure 4. The sum of stayers and leavers equals the total number of people served, and similarly for the sum of newcomers and returnees.
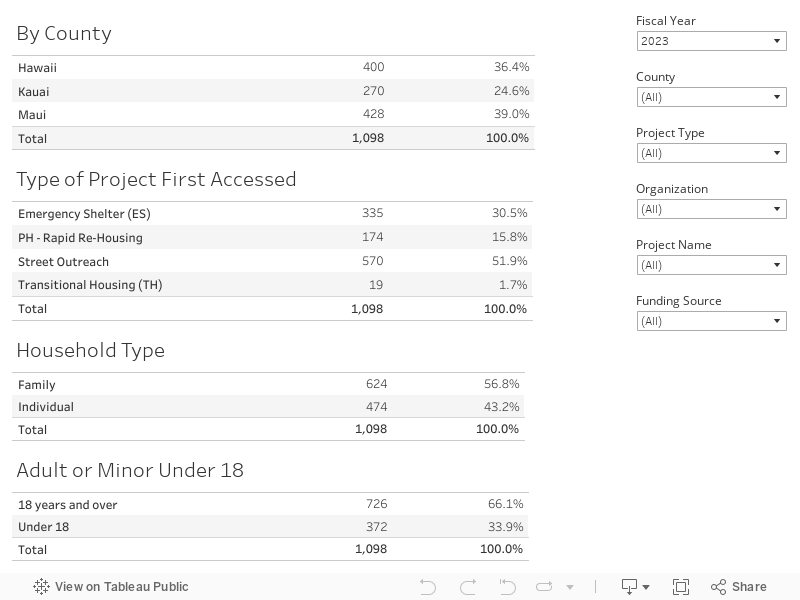
Shows statistics for people served that are classified as newcomers. Newcomers have no HMIS history other than the current enrollment. The total for each of the four tables matches the number of newcomers in other dashboard sections. Sections include numbers served by county, the type of HMIS project first accessed, what type of household the person belongs to, and whether the person is an adult or child. A family household contains at least one member that is under the age of 18 at entry.
Shows annual percentage change data for newcomers by rural county. Each year highlights the percentage change in newcomers compared to the previous, where newcomers are defined as having no HMIS history other than the current enrollment.
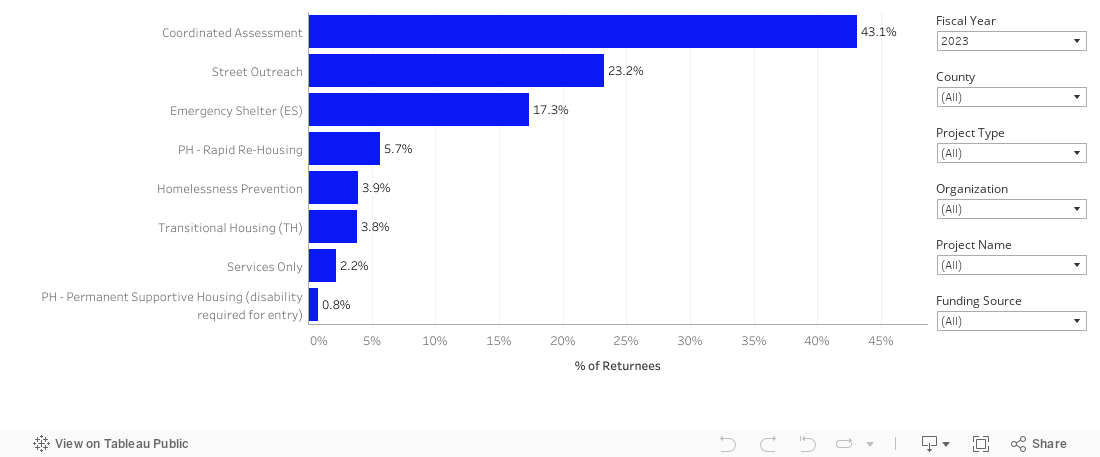
The number of returnees in the year is used as the universe for calculating the percentages displayed. Returnees included in the chart’s universe have more than one enrollment in the HMIS, in alignment with the number of returnees presented in Fig 4. The distribution shows the percentage by project type using the enrollment just prior to the current enrollment for all returnees. Hovering over each bar displays the total returnees by category.
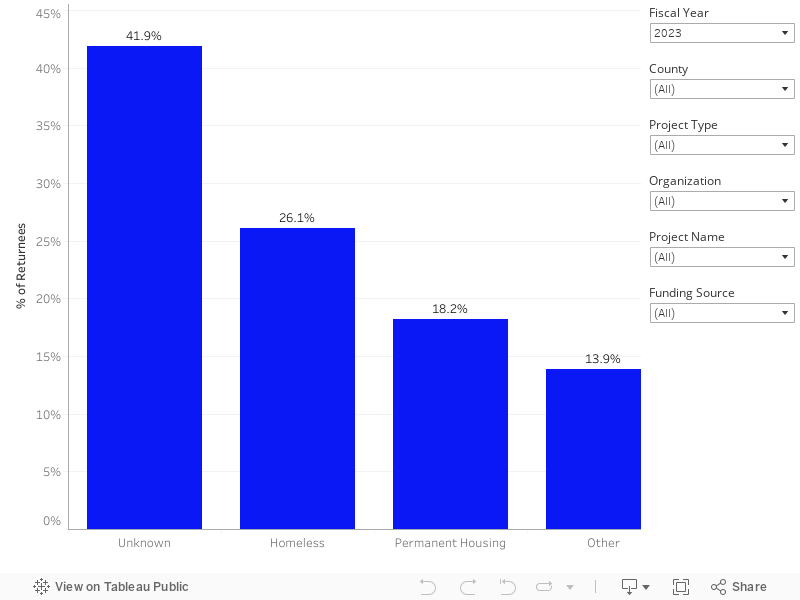
A returnee is included in this chart’s universe if they were discharged from a project prior to the entry date of the current enrollment. Should a returnee have more than one exit that qualifies, the most recent exit is used. The universe of returnees for this chart will be significantly less than Fig 4 since many returnees do not meet the qualifying criteria. The figure displays the percentage of returnees by exit destination. Hovering over each bar displays the returnee count.
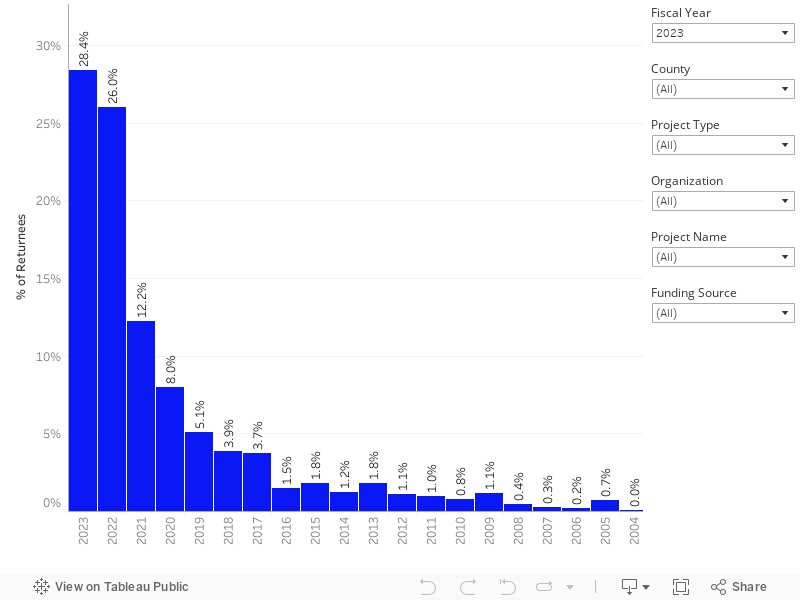
Displays the percentage of returnees by year of last exit for the universe of returnees in Fig 8b. Hovering over each bar displays the returnee count for that year.
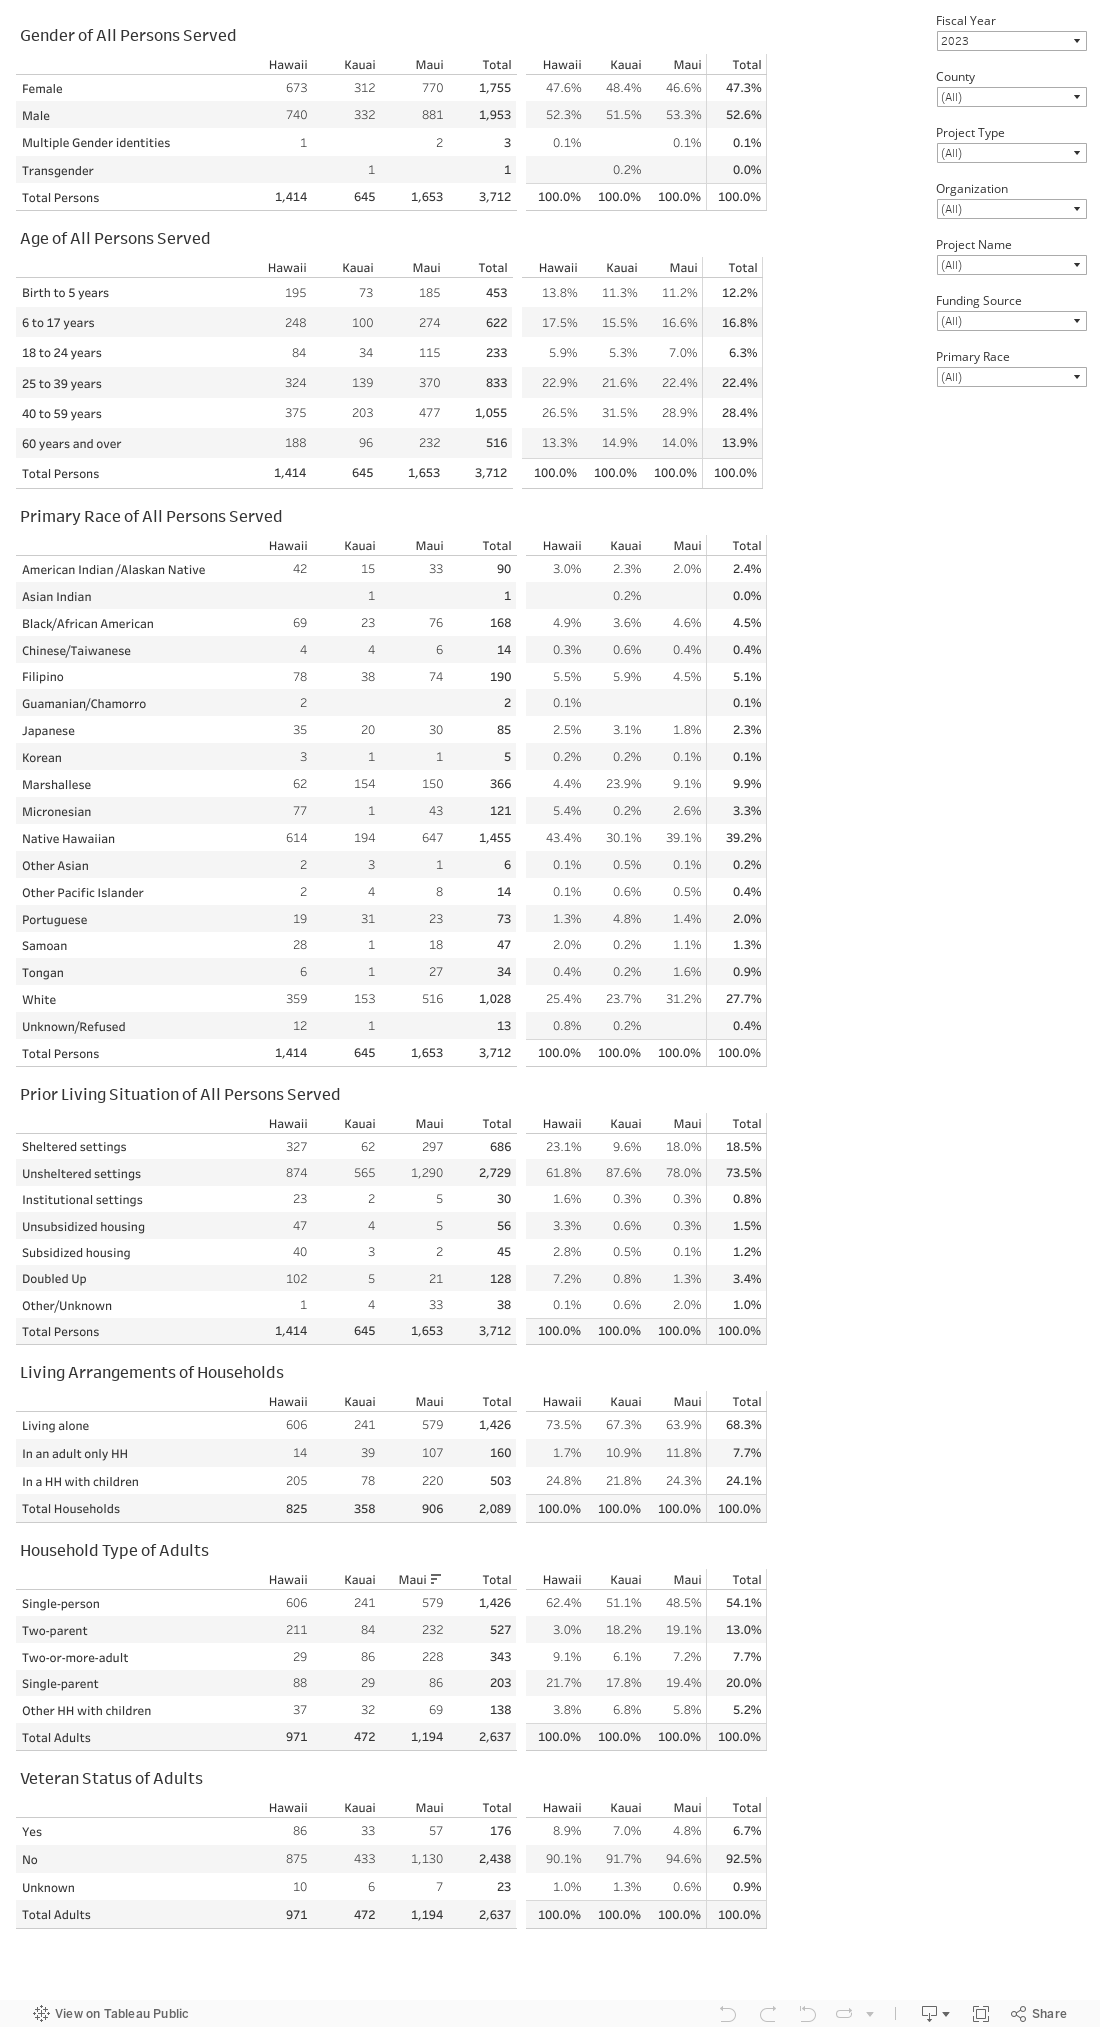
Presents demographic characteristics of people, households, and adults served during the year. The basis for gender, age, race, and prior living situation data is the total number of people served. The living arrangement section leverages total households served; while household type and veteran status are based on the total number of adults served. Data is collected at project entry and recorded in the HMIS.
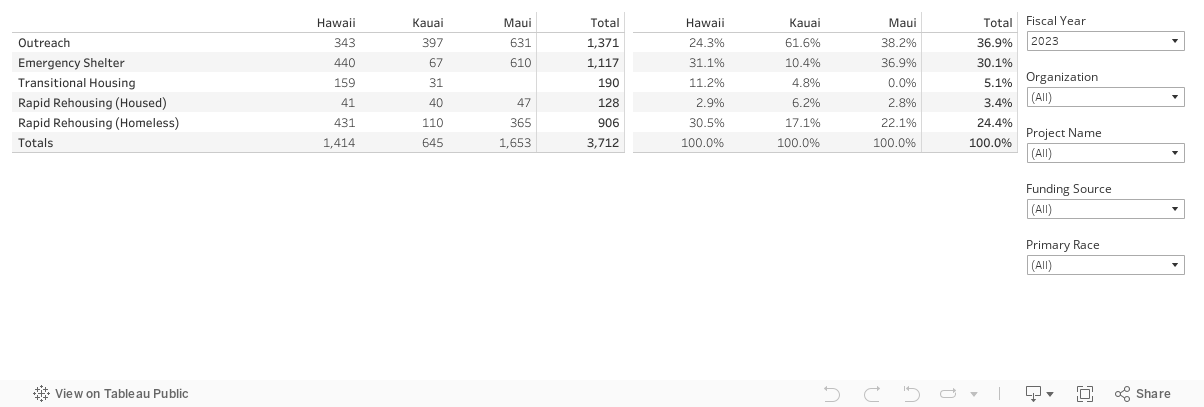
Presents the total number of people served annually in each rural county and BTG. The table shows total served by project type and percentage of the total.
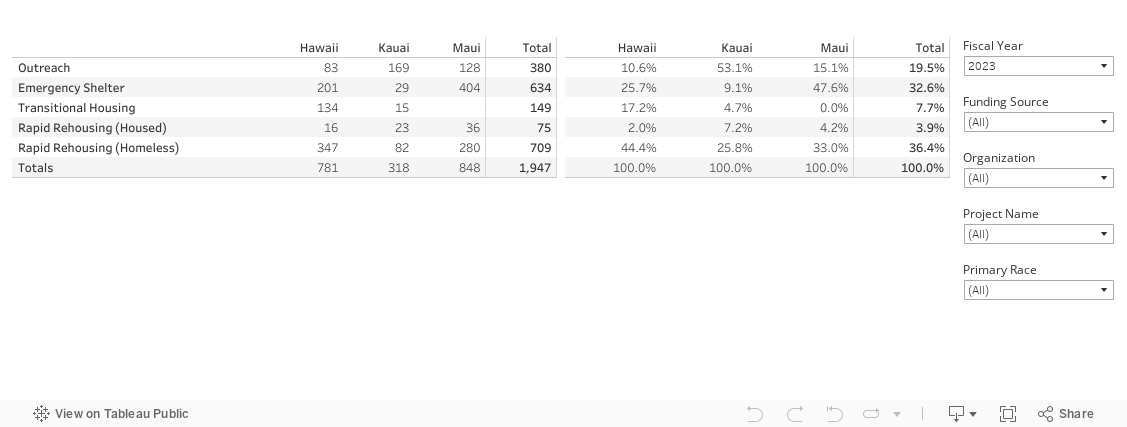
Presents the total number of people served in families annually in each rural county and BTG. The table shows total family individuals served by project type and percentage of the total. A family household contains at least one member that is under the age of 18 at entry.
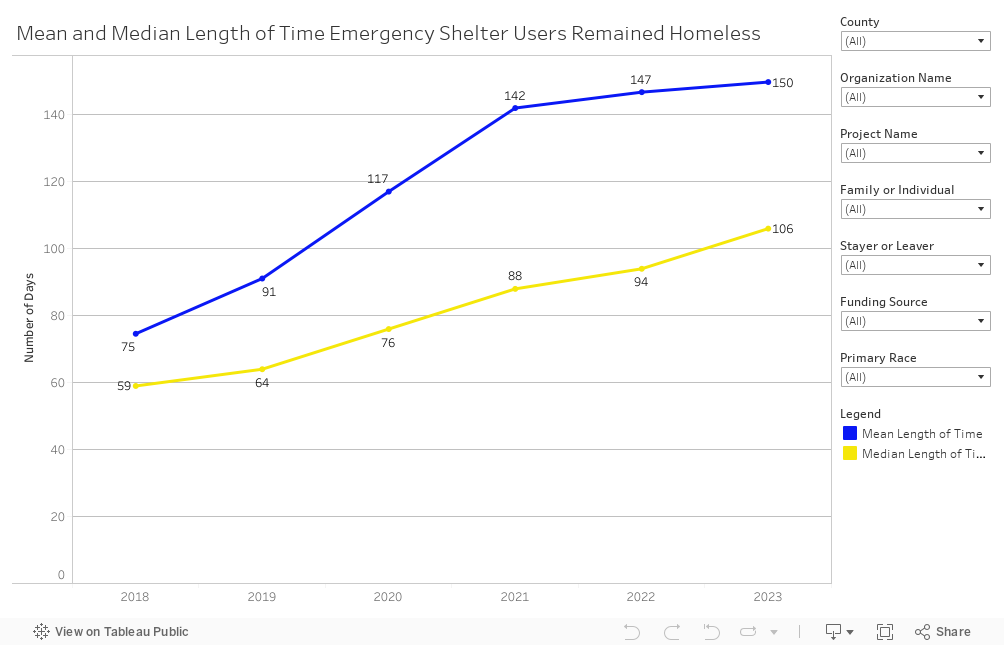
Presents mean and median length of stay (LOS) in days for people served in emergency shelters. The chart defaults to display data for all served in the period, however, data can be filtered for stayers or leavers. Stayers remain actively enrolled at the end of each year, while leavers exit at some point during the year. For stayers, the entry date and fiscal year end are used to calculate LOS, while for leavers the entry and exit dates are used. LOS data is then compiled for all clients served in the year to generate the statistics.
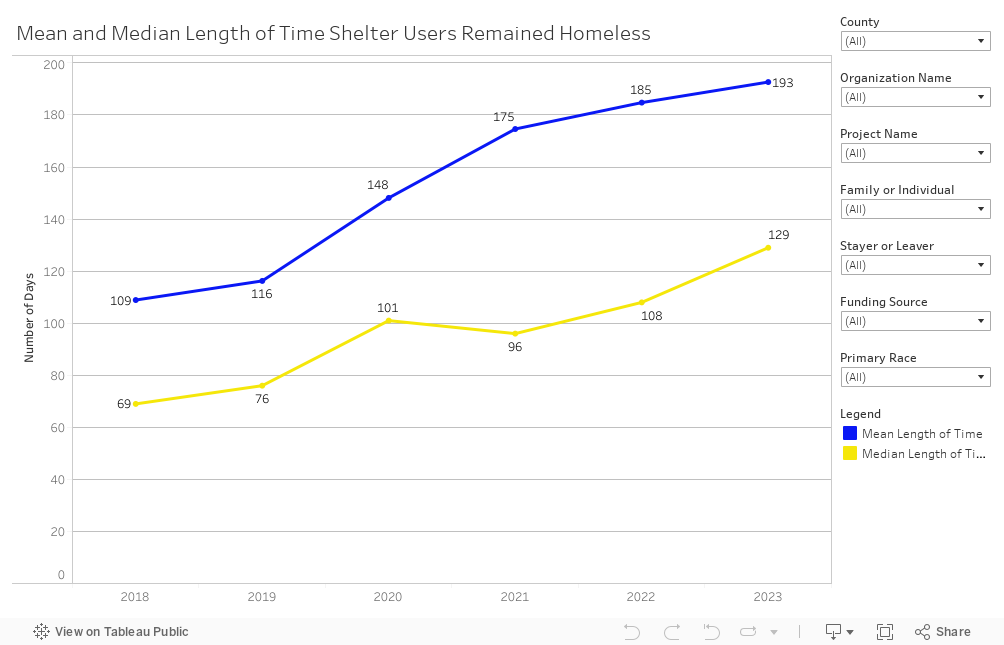
Presents mean and median length of stay (LOS) in days for people served in emergency shelters and transitional housing. The chart defaults to display data for all served in the period, however, data can be filtered for stayers or leavers. Stayers remain actively enrolled at the end of each year, while leavers exit at some point during the year. For stayers, the entry date and fiscal year end are used to calculate LOS, while for leavers the entry and exit dates are used. LOS data is then compiled for all clients served in the year to generate the statistics.
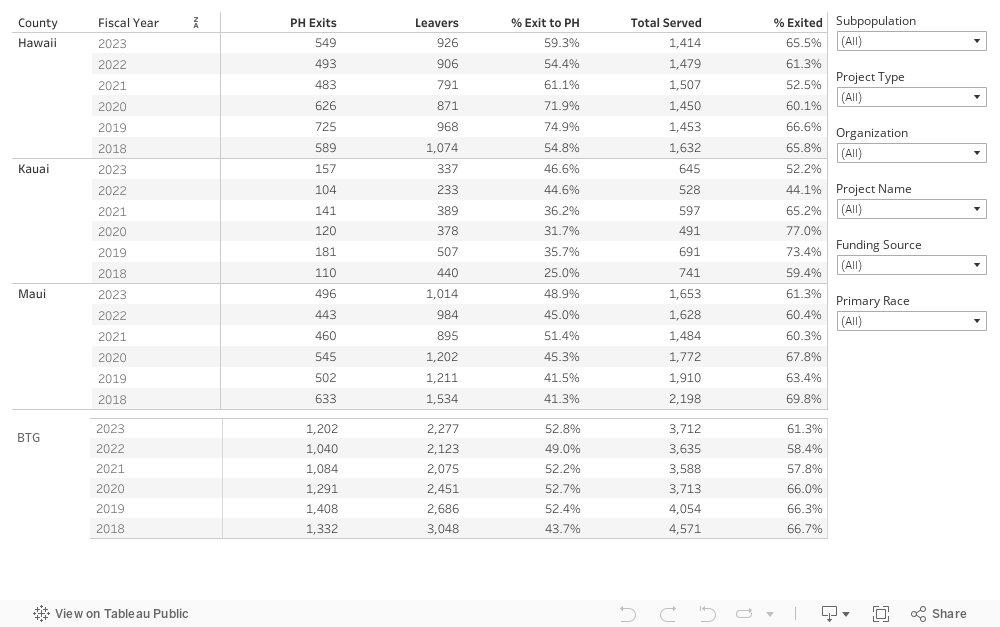
Displays the number of permanent housing exits, total exits, permanent housing exit rate, total served, and percent of those served that have exited. Total served and exited match the totals presented in other figures and tables.
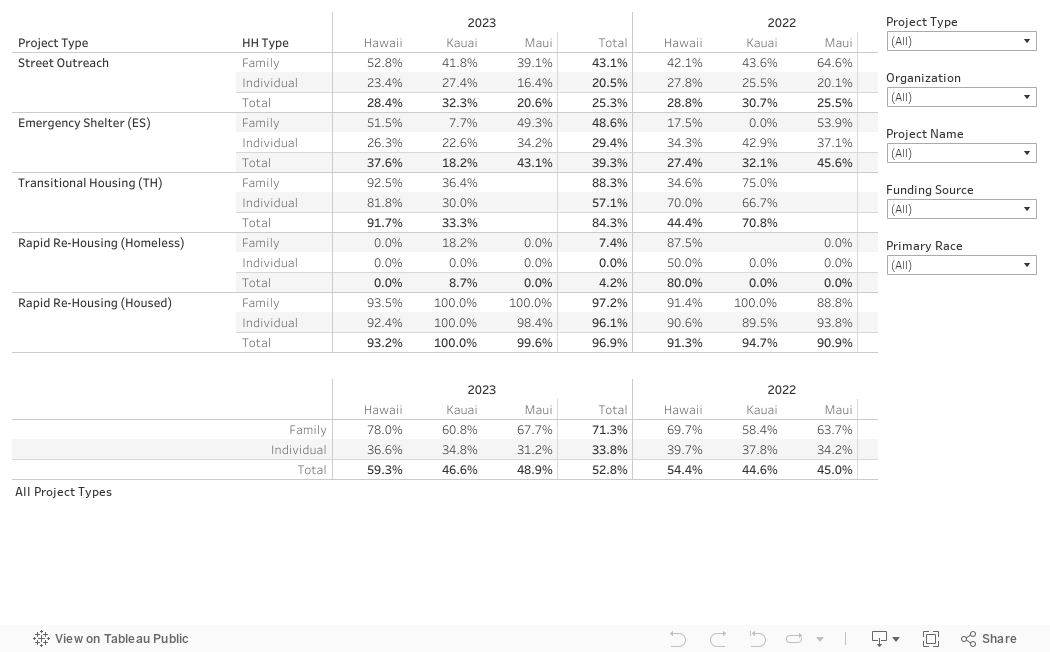
Highlights permanent housing exit rates by project type, household type, rural county, and fiscal year dating back to 2018. Blanks in the table indicate that there were no exits for that section. A family household contains at least one member that is under the age of 18 at entry. An individual household contains no members under the age of 18 at entry, most of these households are single individuals. The tooltip for each rate shows the raw count of permanent housing exits and total exits.
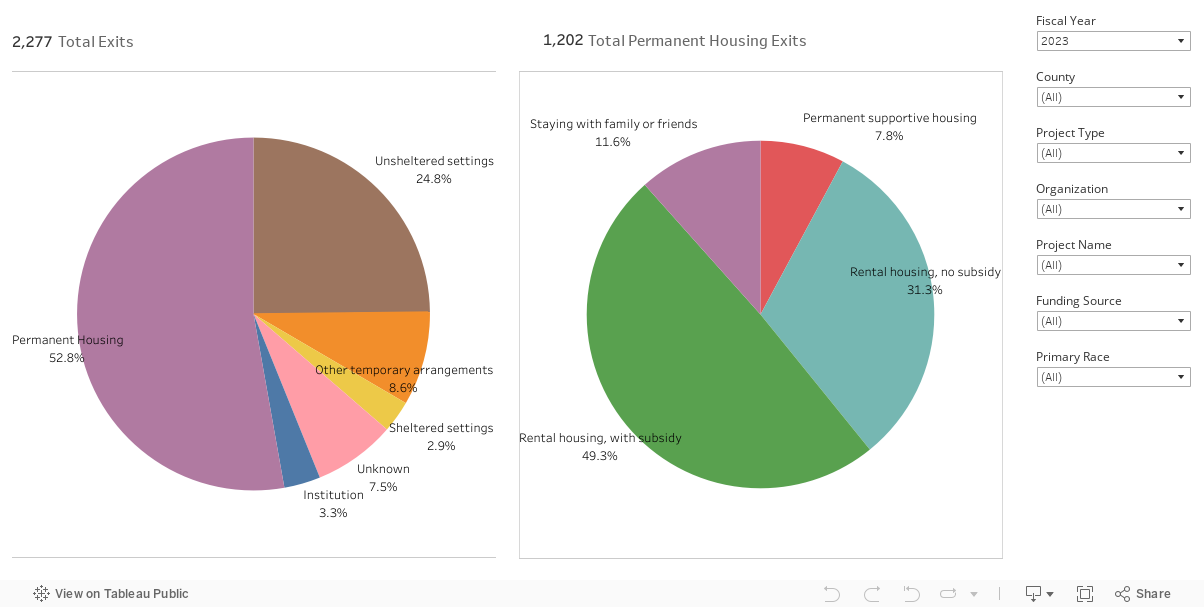
Presents exit destination statistics for all people exiting during the year. The chart on the left categorizes exits during the year by the exit destination type shown. The chart on the right categorizes permanent housing exits during the year by the permanent exit destination type shown. The tooltip displays total people within each sector.
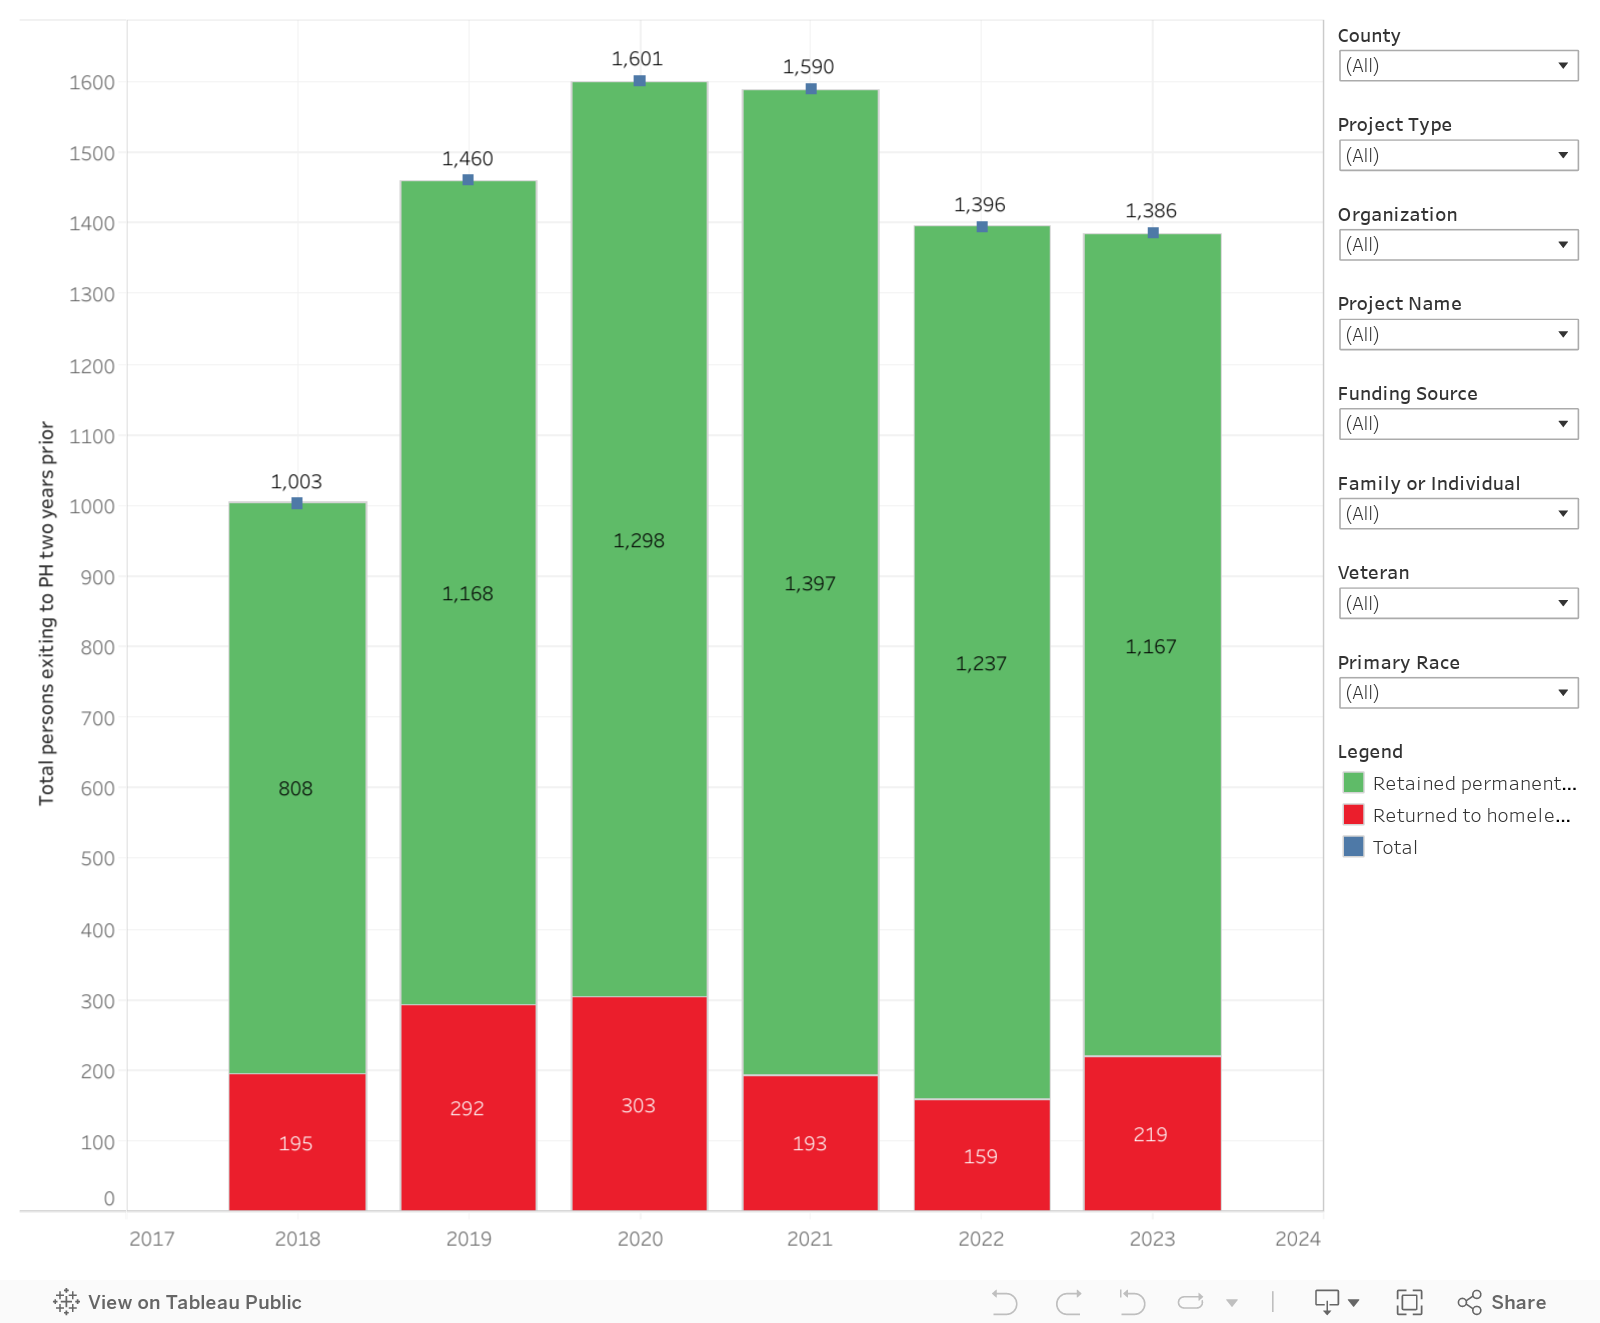
This figure utilizes HUD’s System Performance Measure recidivism methodology to show the extent to which people exiting to permanent housing return to homelessness. The total number of people exiting to permanent housing two years prior to the fiscal year presented is displayed above the green bars, while the number of those people retaining housing or returning to homelessness within two years is presented in the green and red bars respectively. The figure defaults to display data for BTG. Hovering over the bars produces a tooltip, identifying retention and recidivism rates based on what is filtered.