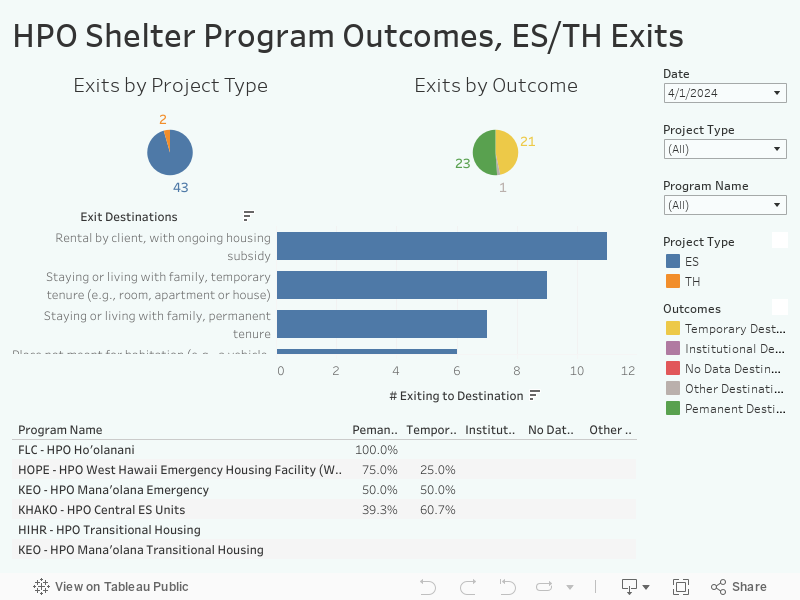
These charts provide a graphical view of exits from HPO Funded Shelter programs. The pie charts provide a quick look at the number of exits by project type and by outcome. The bar chart shows exit destinations, ordered by greatest number. The table shows the outcomes for each program, ordered by the percent exiting to permanent housing. Use the filter options on the right to limit or expand by month, project type, or program.
These line graphs provide a look at placements into Permanent Housing from HPO Funded Shelter programs over time. The first graph is a simple count while the second graph shows the rate of permanent housing placements as a percentage of total exits. Use the legend at the right to filter your view by project type.